Scramble for Land Rights
INFOGRAPHIC
These infographics were designed for World Resources Institute, to accompany the launch of a report titled "Scramble for Land Rights: Reducing Inequalities Between Communities and Companies." The infographic compares how hard it is for communities secure their land rights, having to navigate many barriers and delays, while companies have a relatively easy process, taking advantages of loopholes and advantages. These were built using AI2HTML, to reduce file size and stay readible on screen, while auto switching out different versions depending on screen size.
In addition to the static graphics, we developed an animated version for use on social media. The key takeaway of the story is that most communities never make it through the process of securing their land rights, and those who do face many delays, taking significantly longer than the process companies go through.

Other Projects:
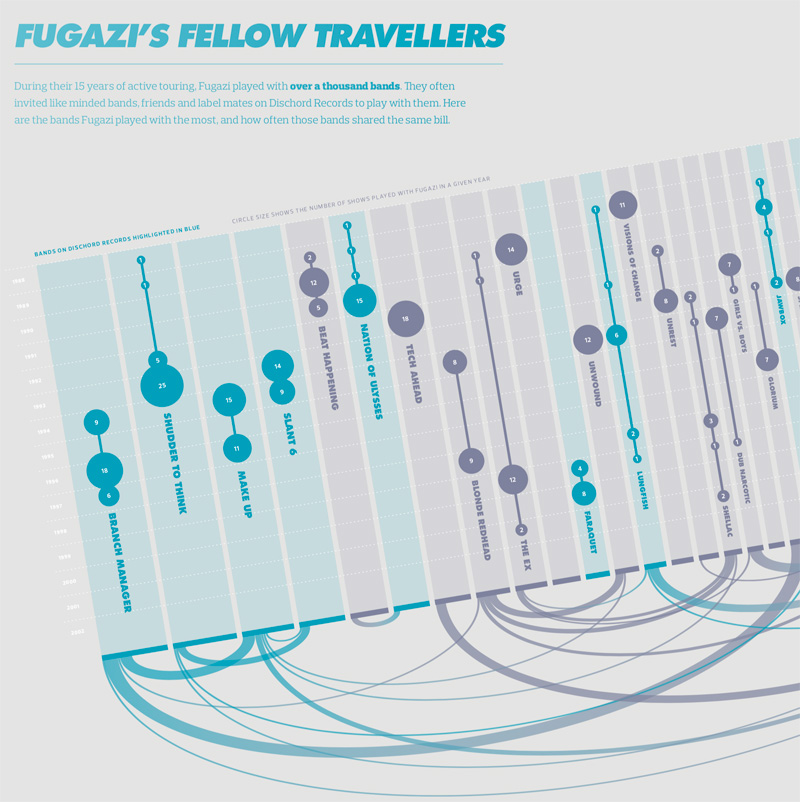
Visualizing the History of FugaziData Visualization
COVID-19 Testing Trends TrackerData Visualization
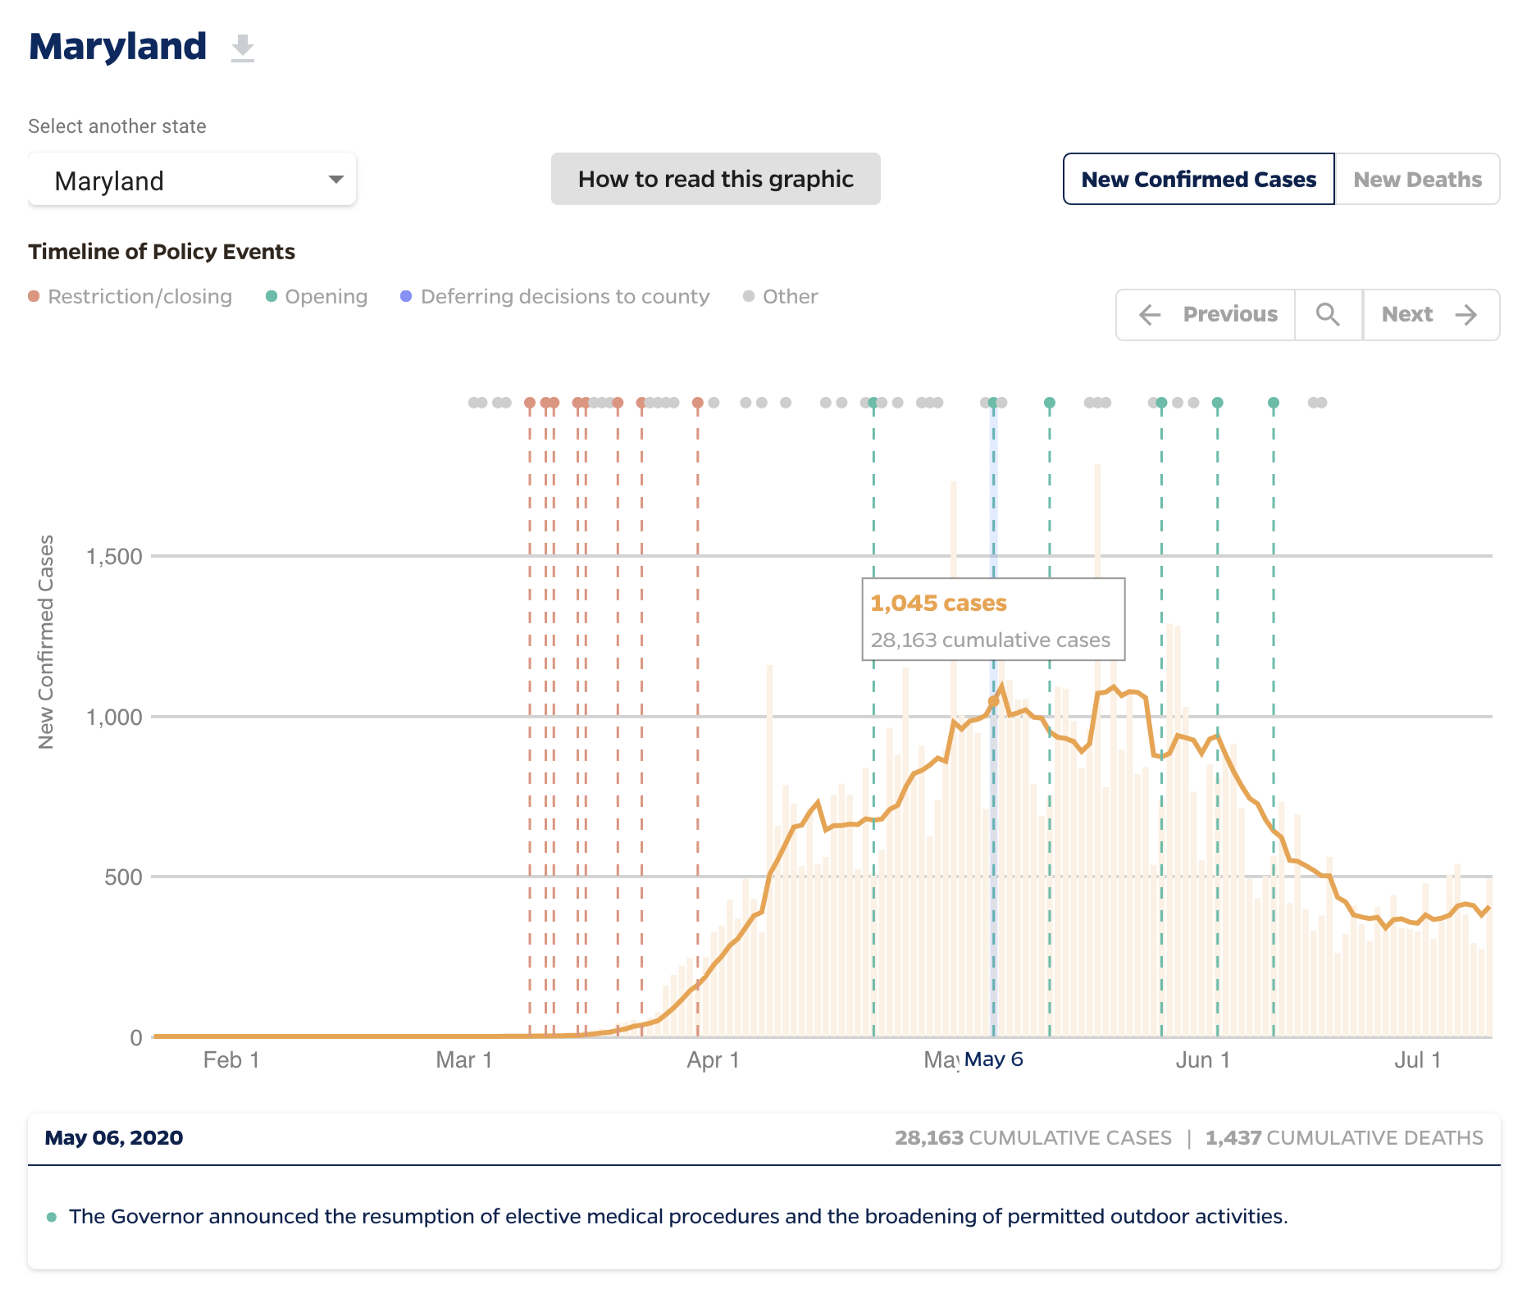
Timeline of COVID Policies in the U.S.Data Visualization
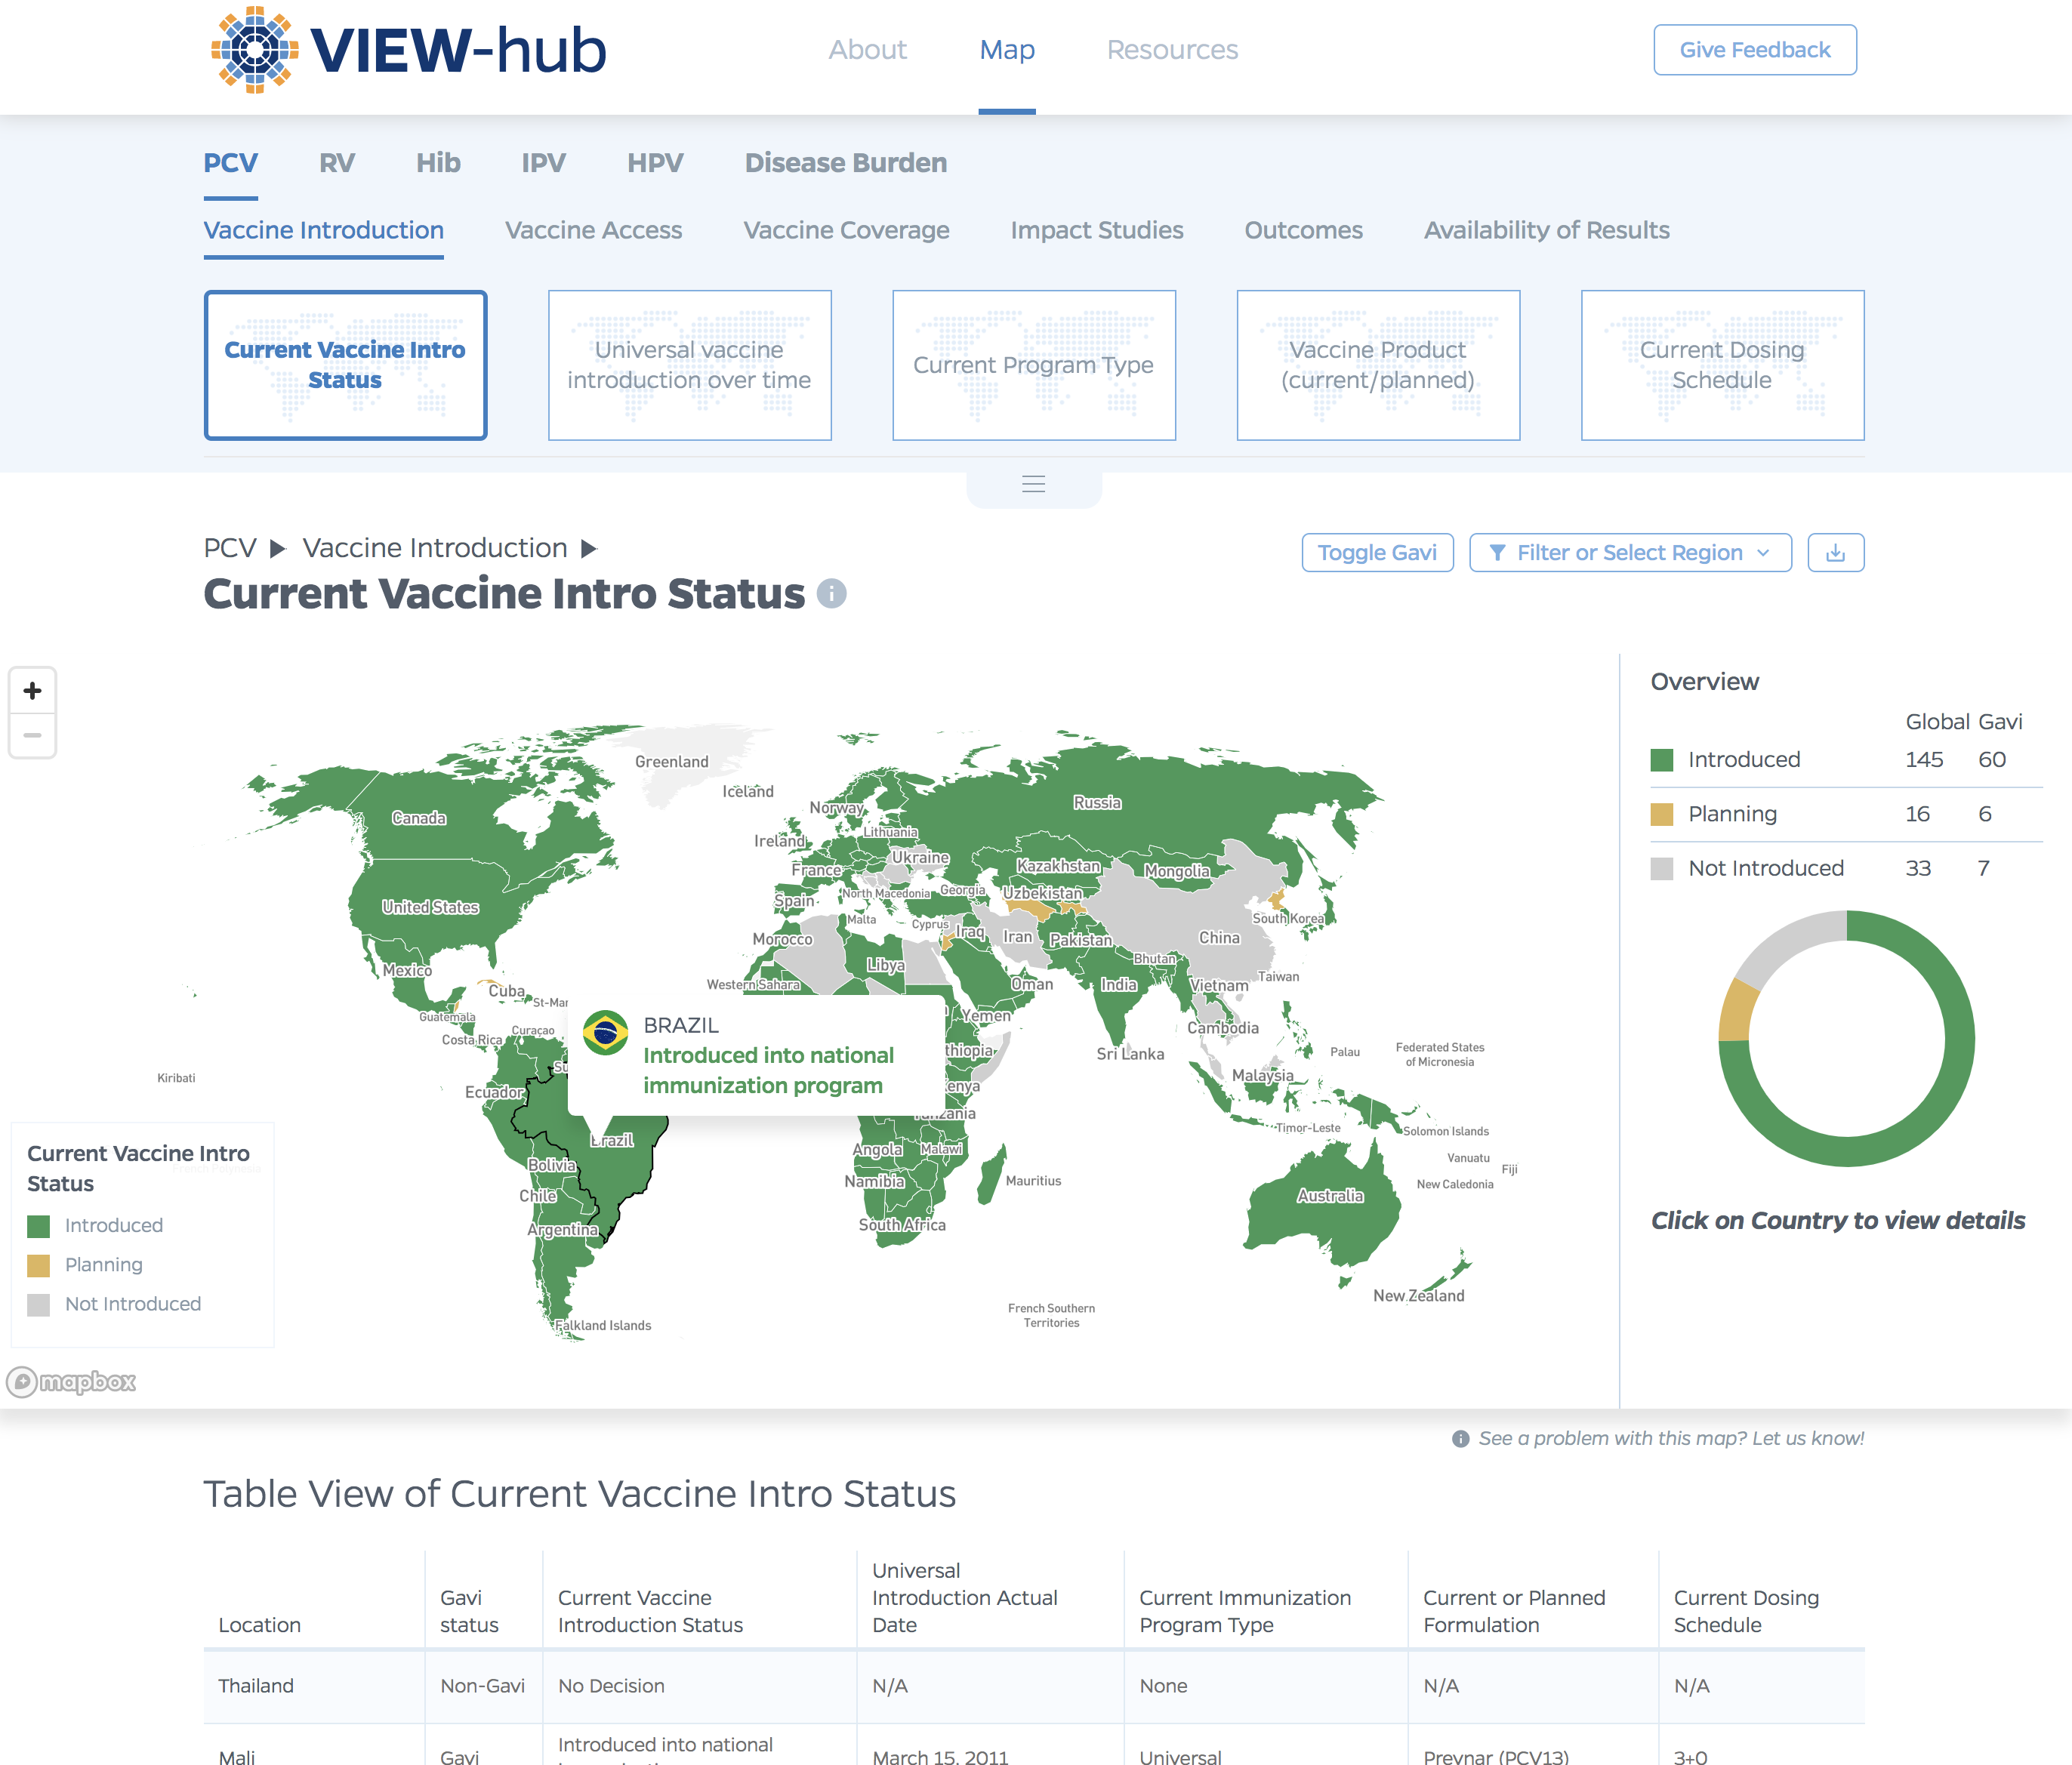
VIEW-hub website designUI/UX Design & Data Visualization
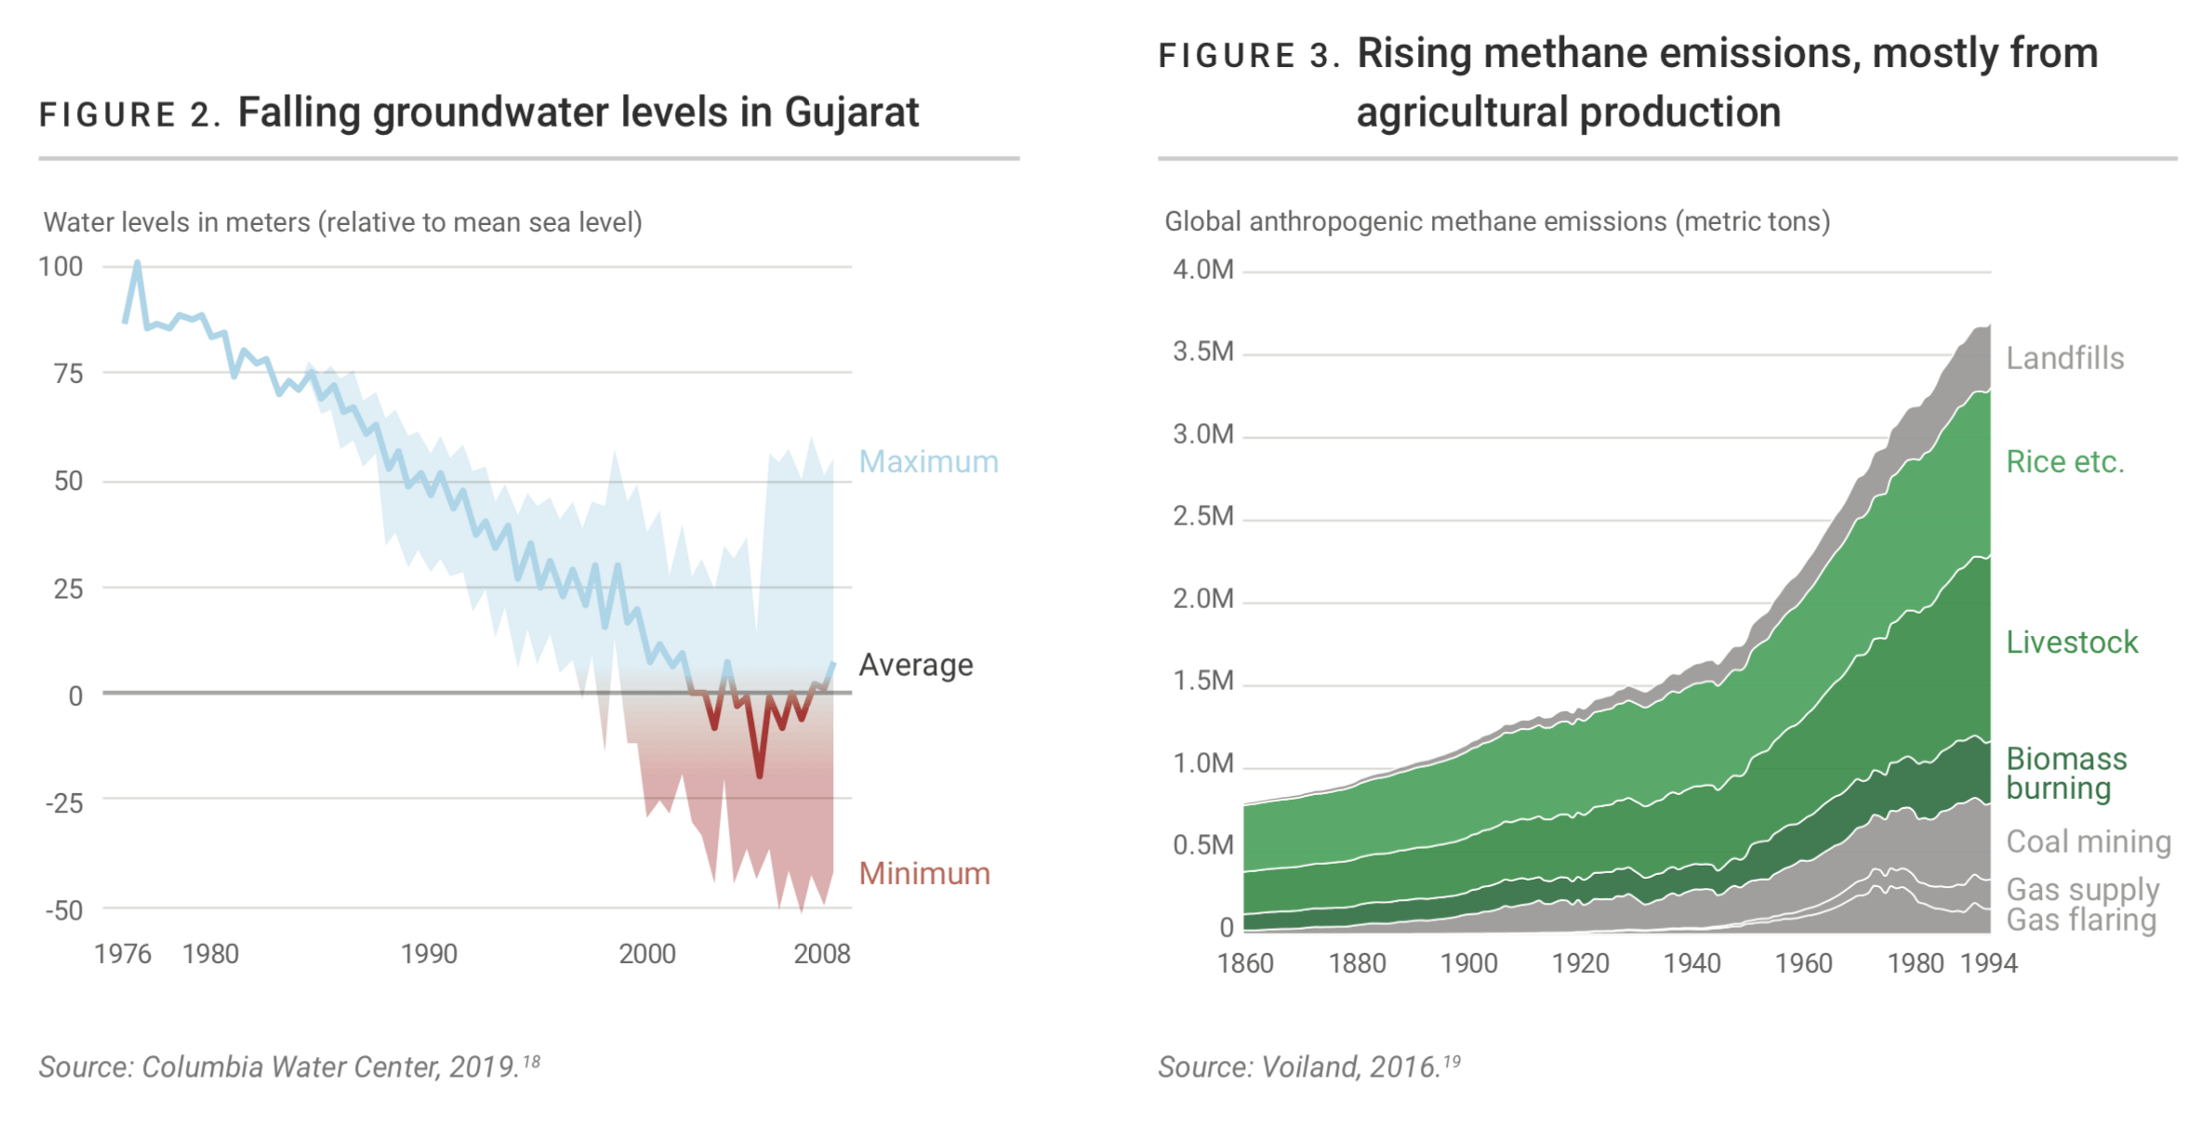
Transforming Food Systems Under Climate ChangeData Visualization & Report Design
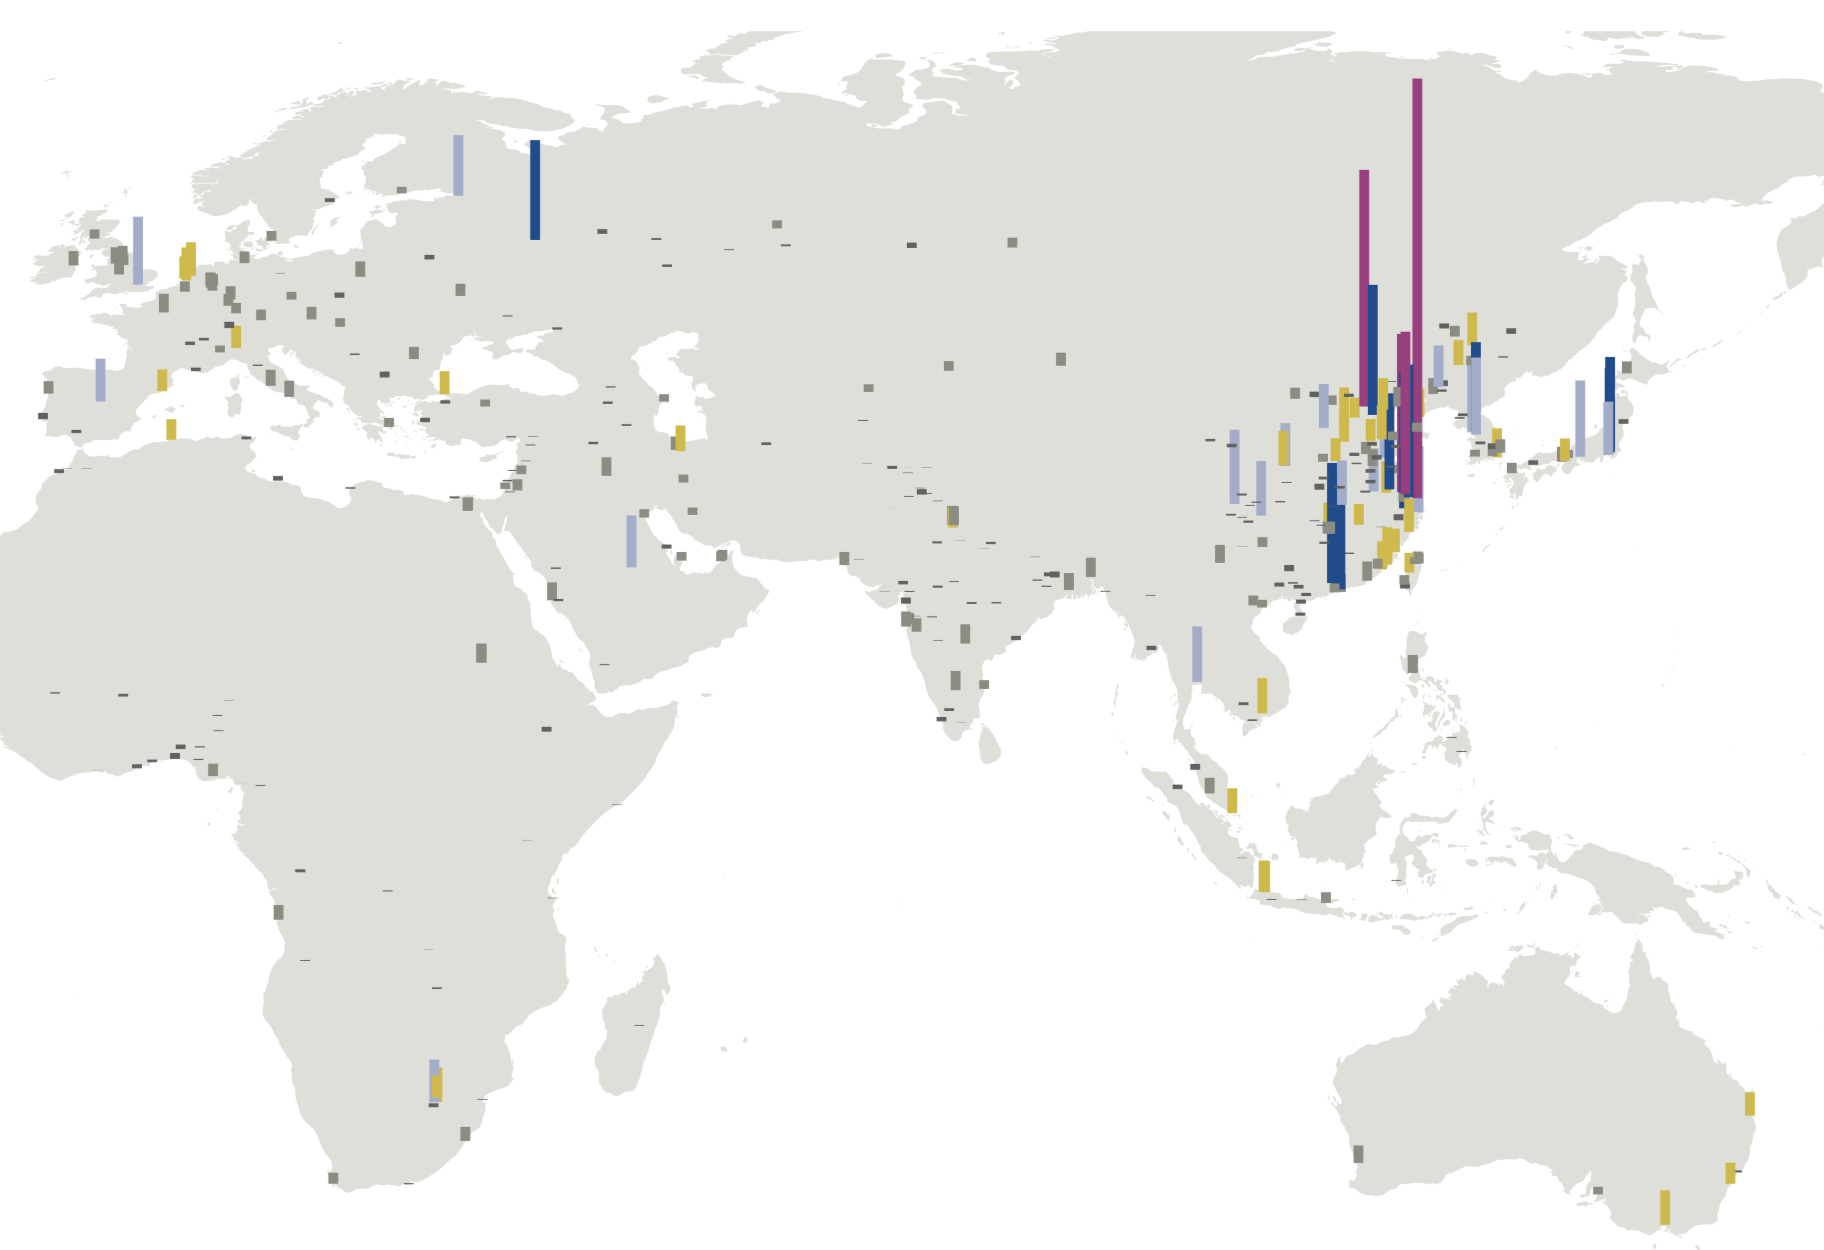
Towards a More Equal CityData Visualization
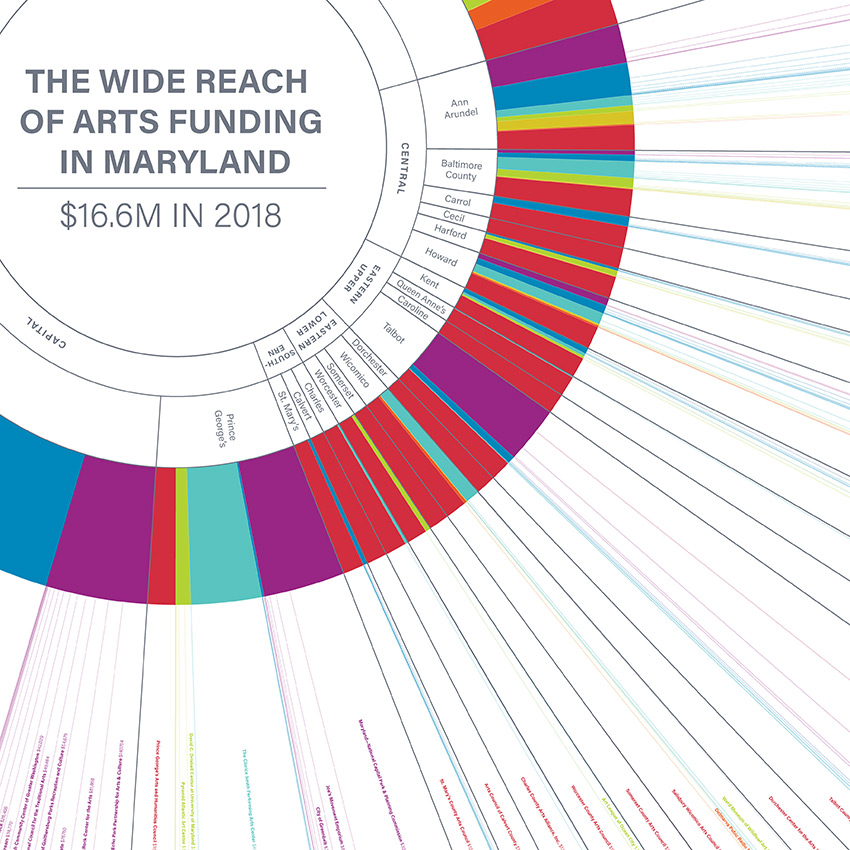
Wide Reach of Arts Funding in MarylandData Visualization
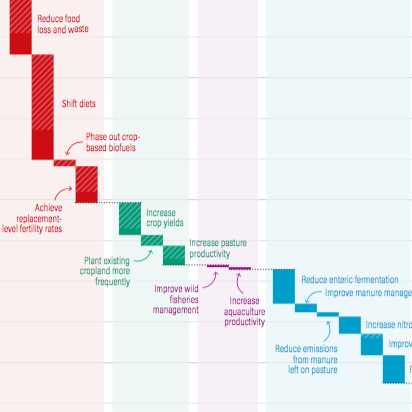
Creating a Sustainable Food FutureData Visualization & Report Design
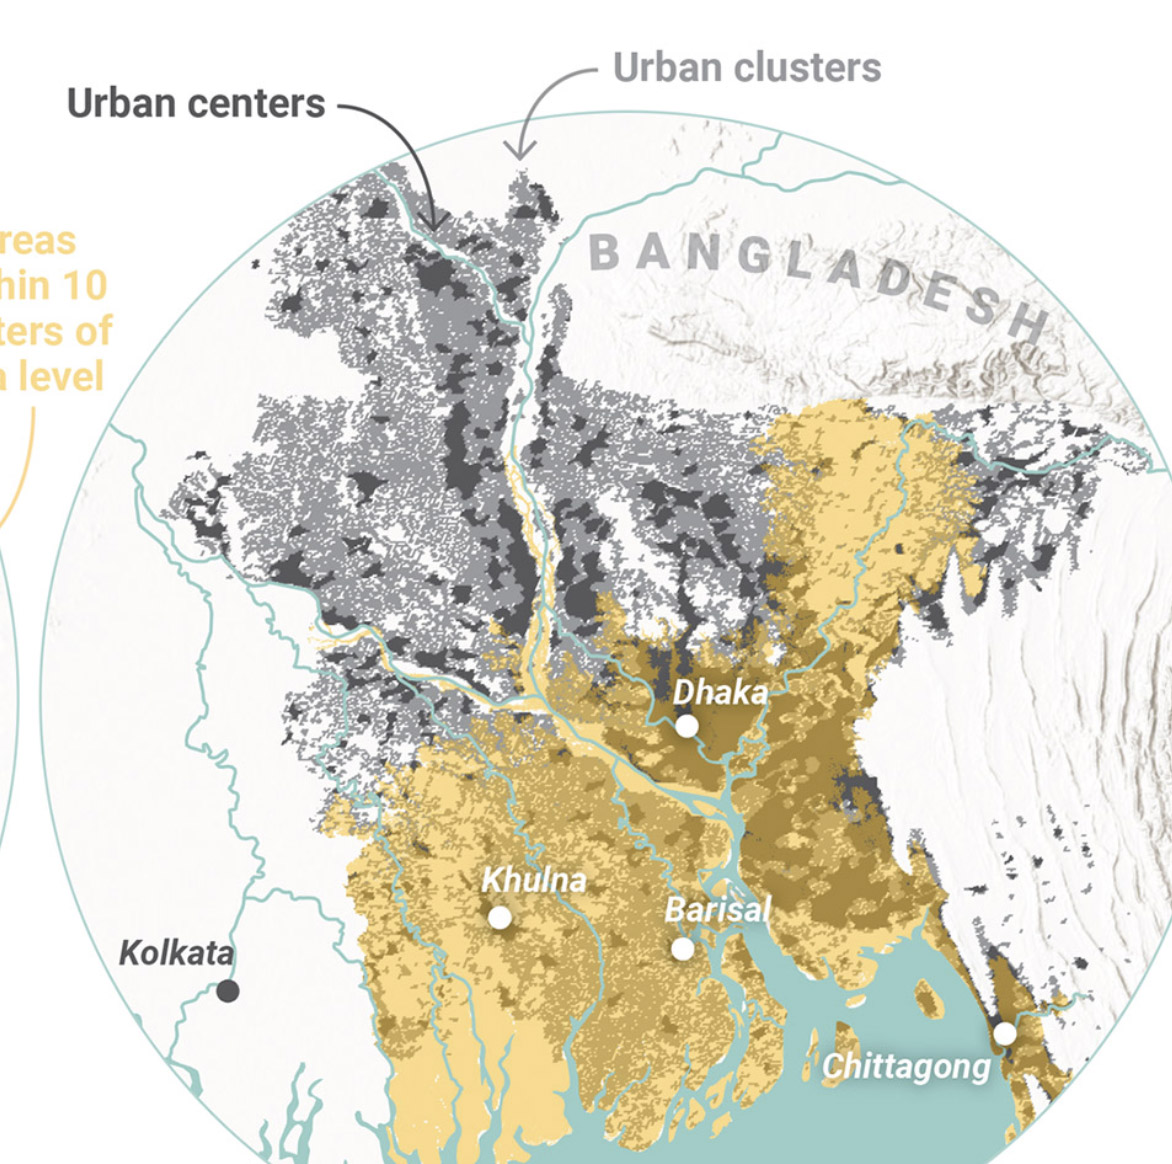
Global Commission on AdaptationMap & Infographic Design
Logo & Branding projectsLogo design
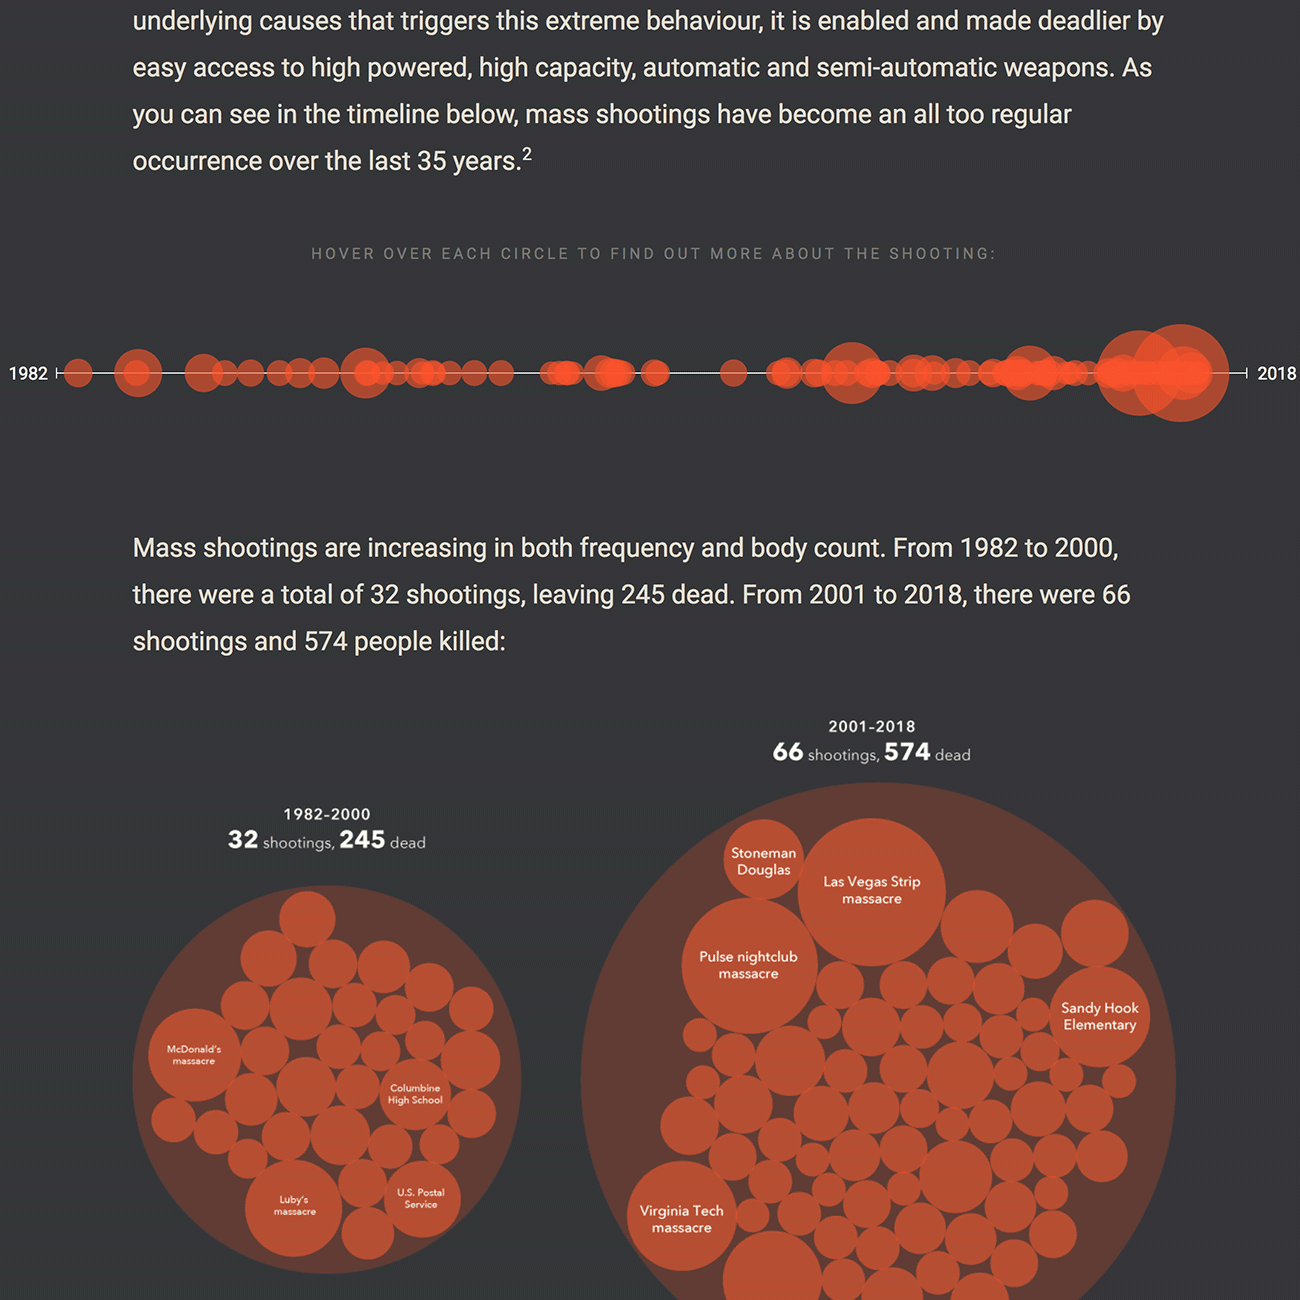
Sensible Gun Laws NowInteractive
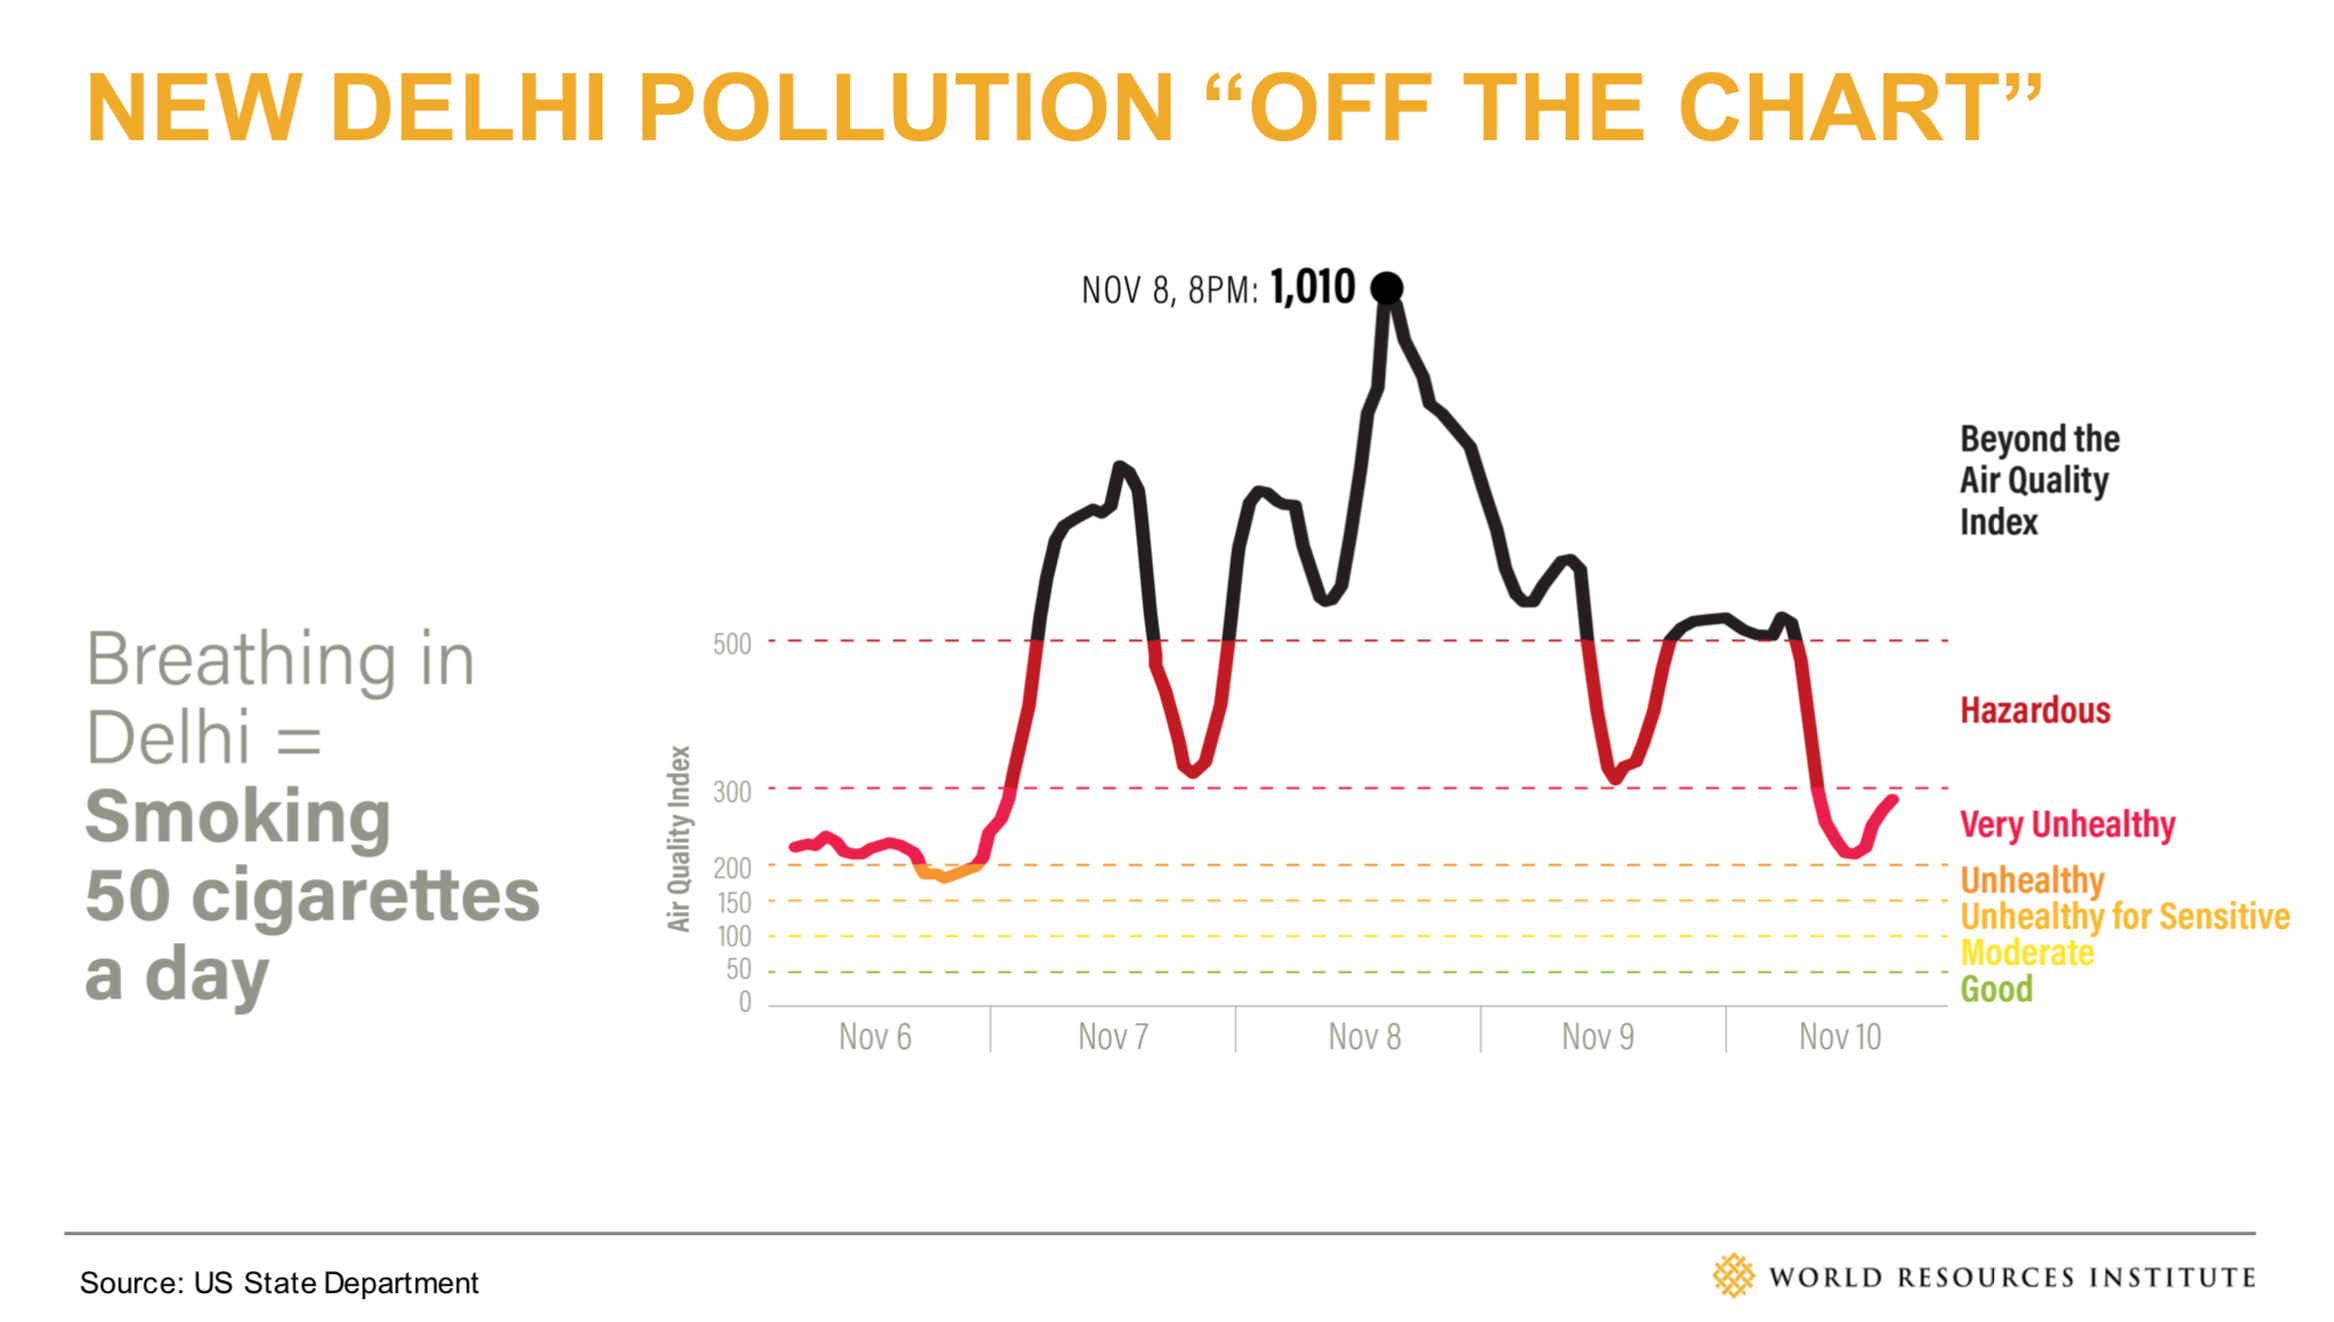
Stories to WatchPresentation Design
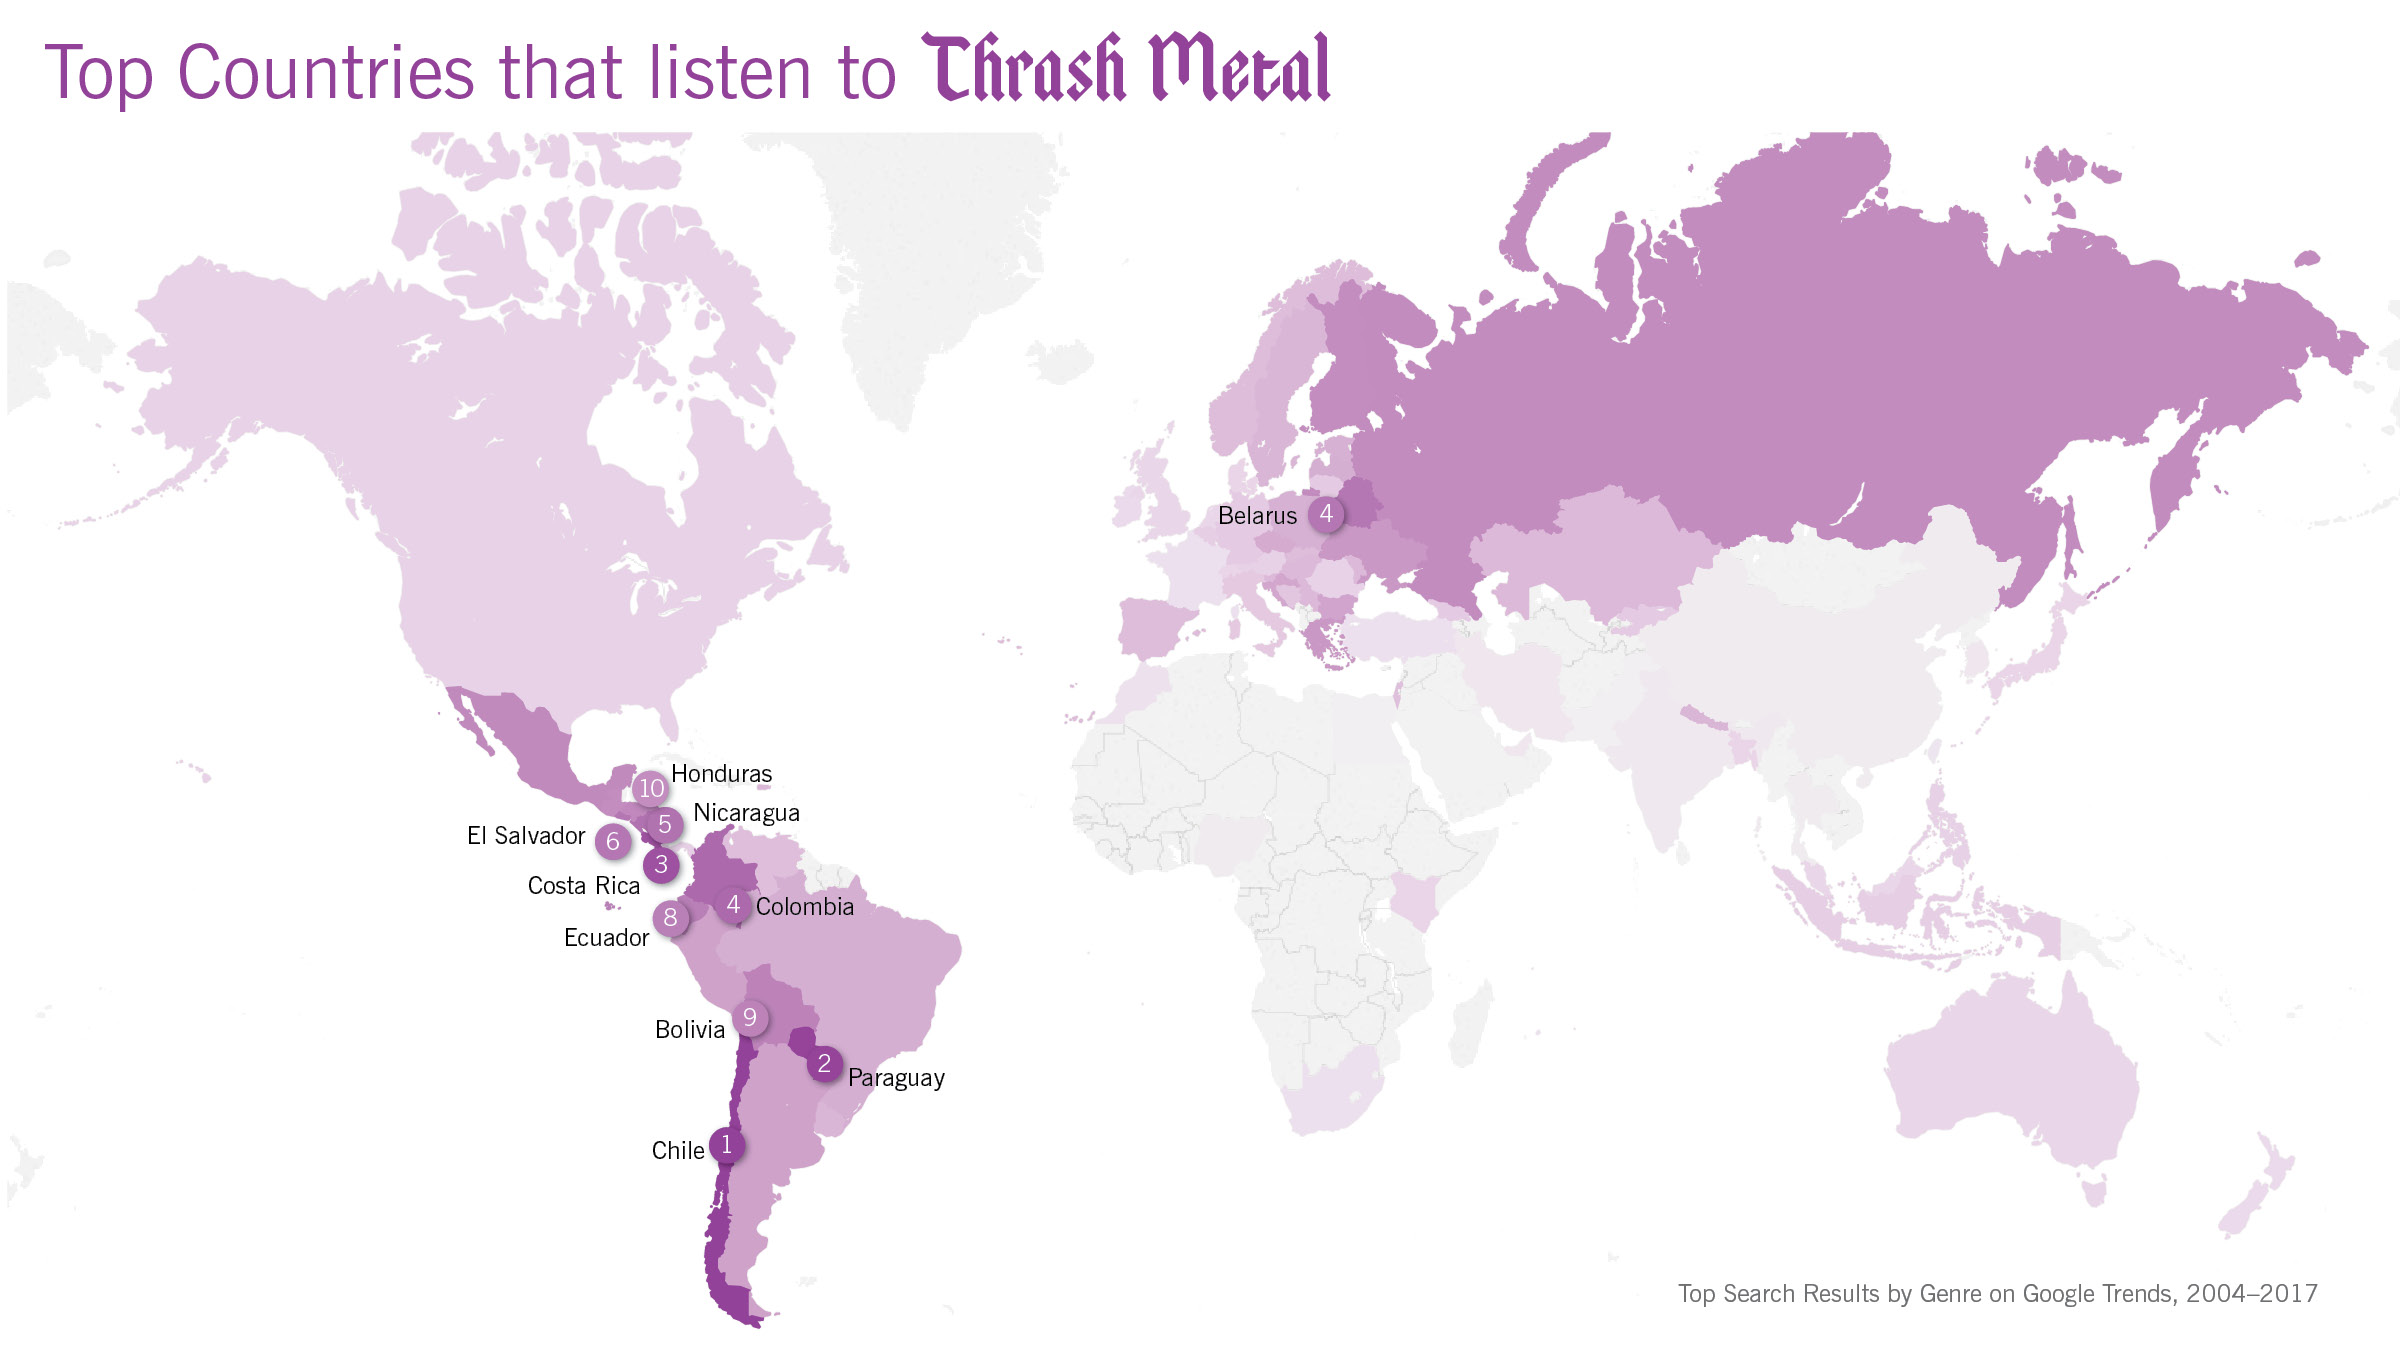
Globetrotting History of MetalData Visualization
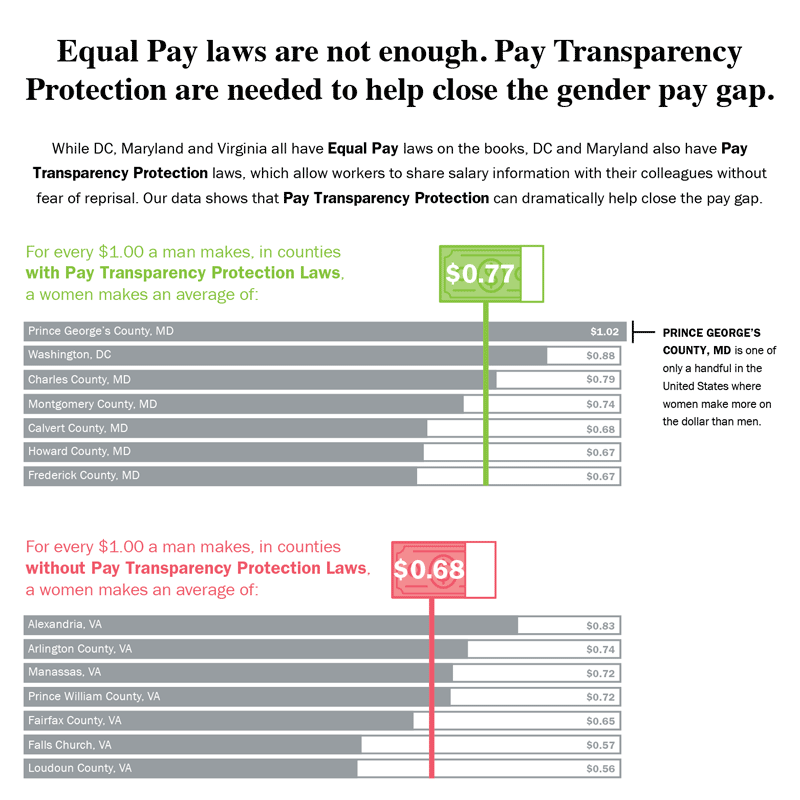
Equal Pay Laws are Not EnoughData Visualization

How to Record Your BandInfographic
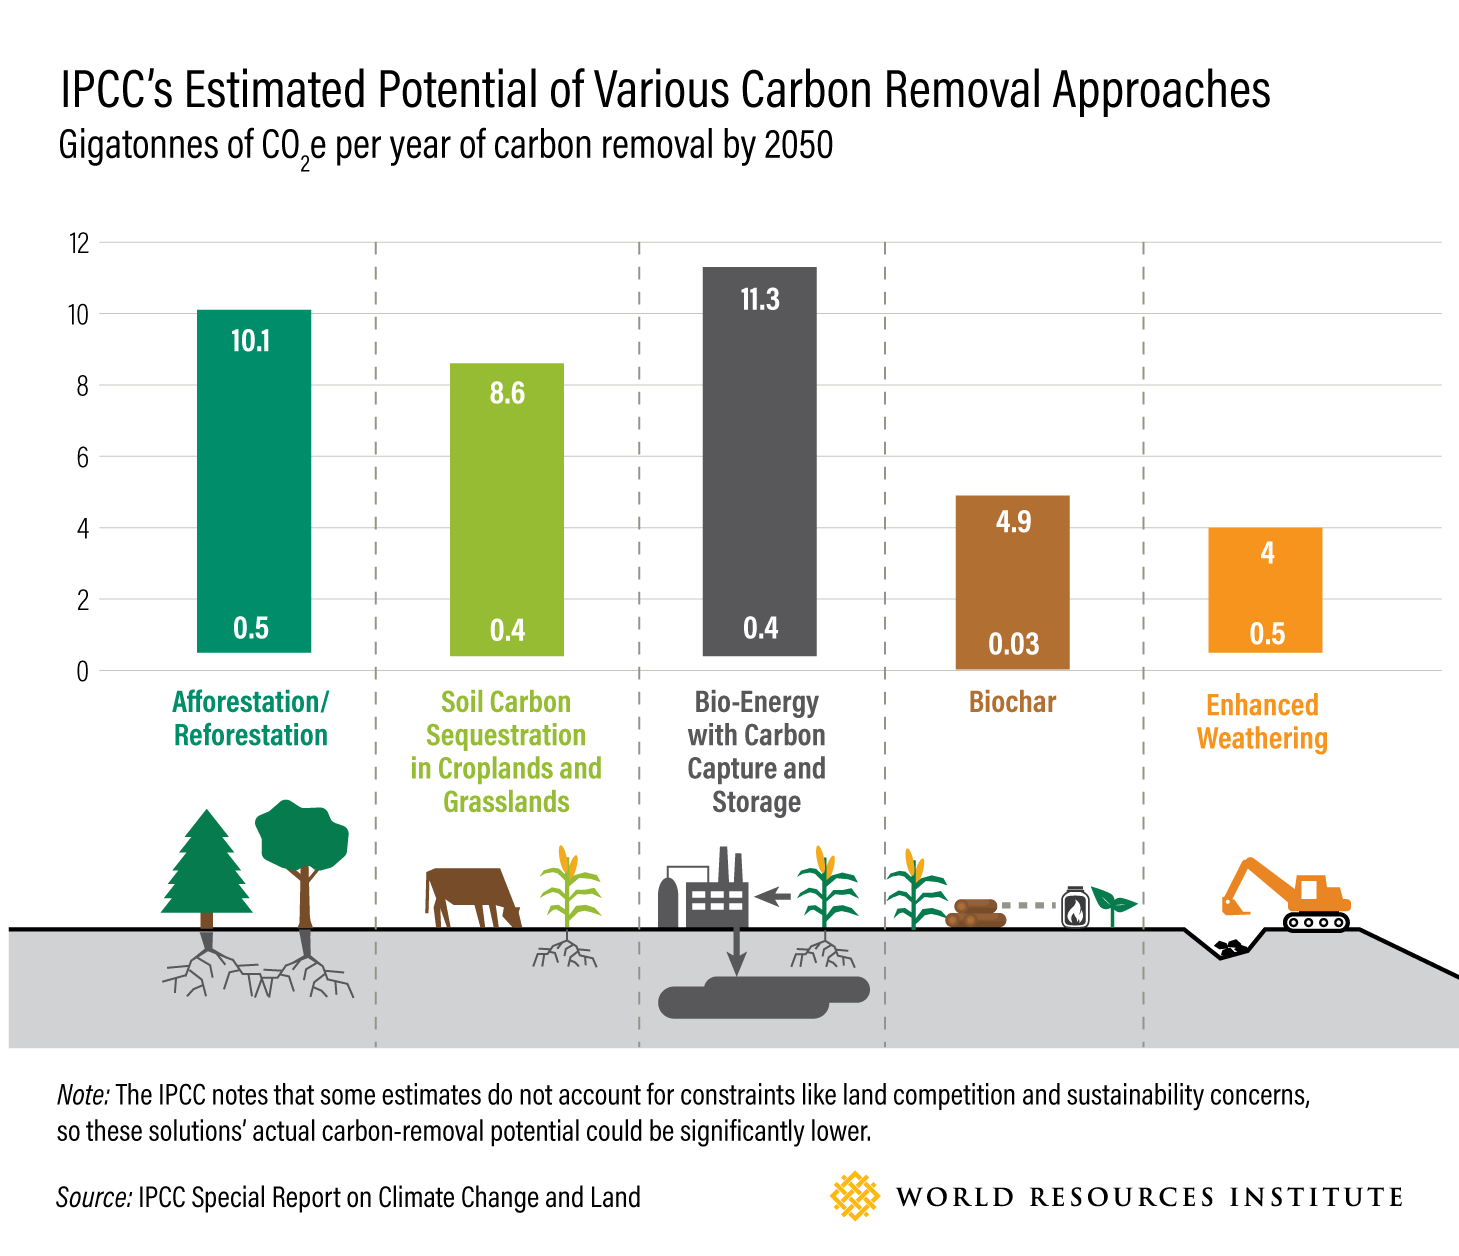
WRI Blog graphicsCharts & graphs
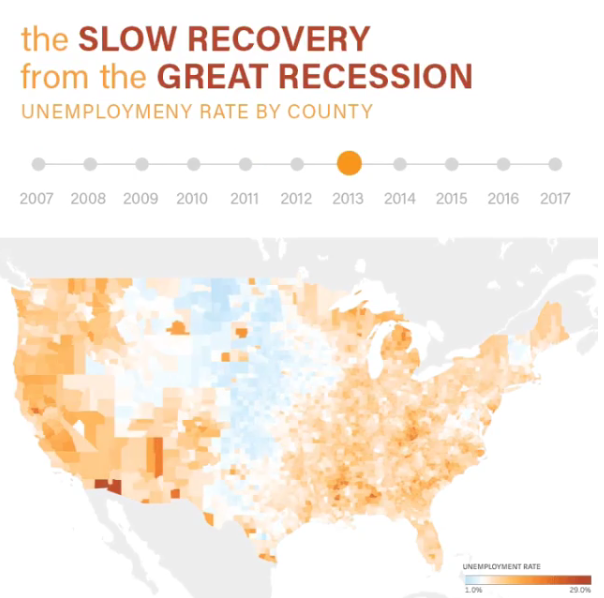
The Slow Recovery from the Great RecessionInteractive
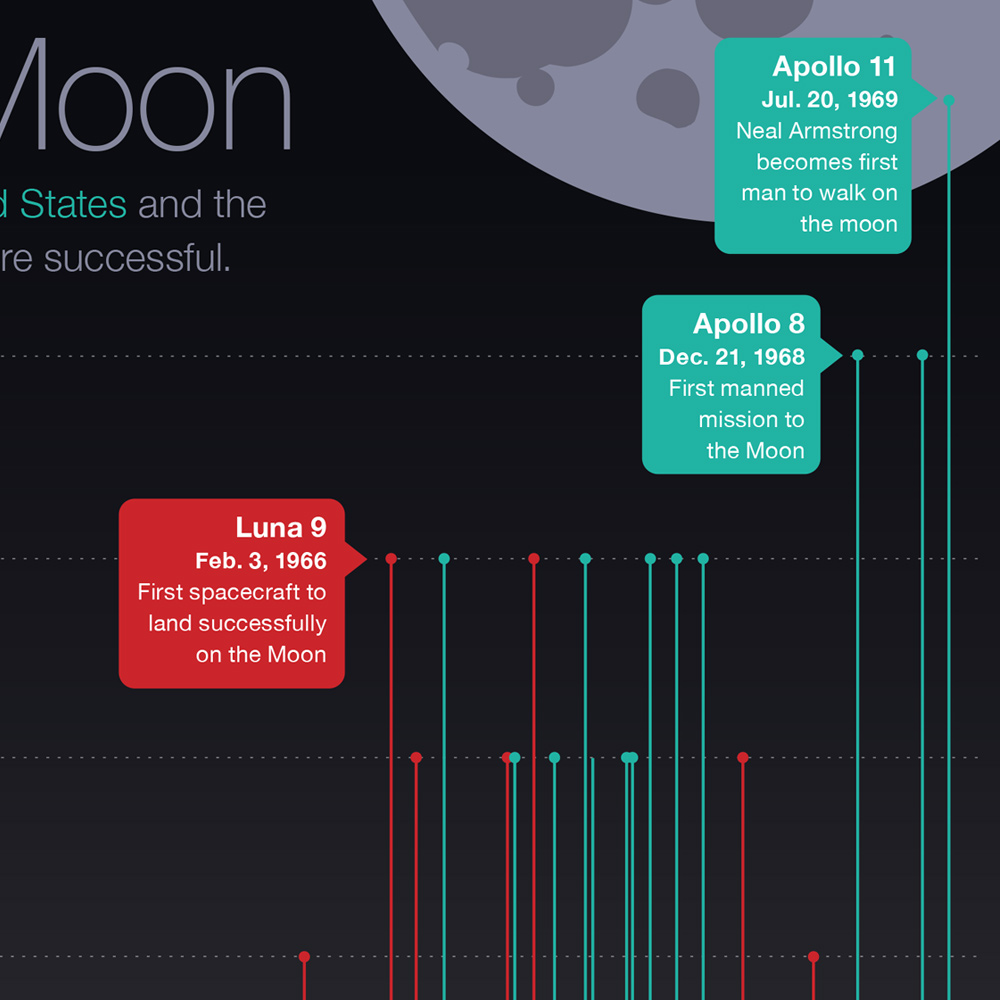
The Race to the MoonInfographic
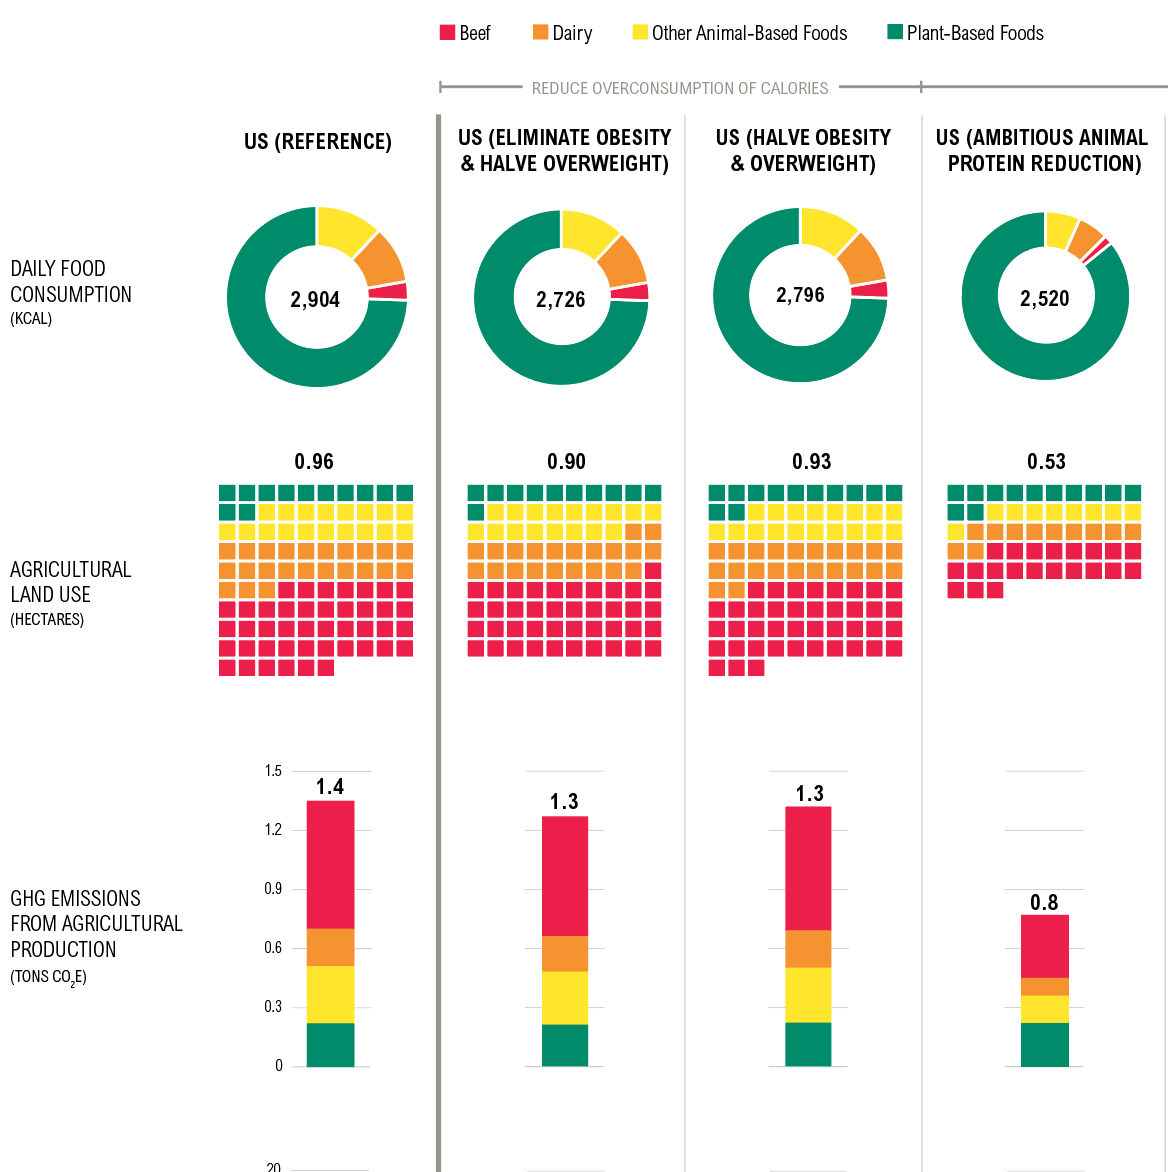
Shifting DietsData visualization
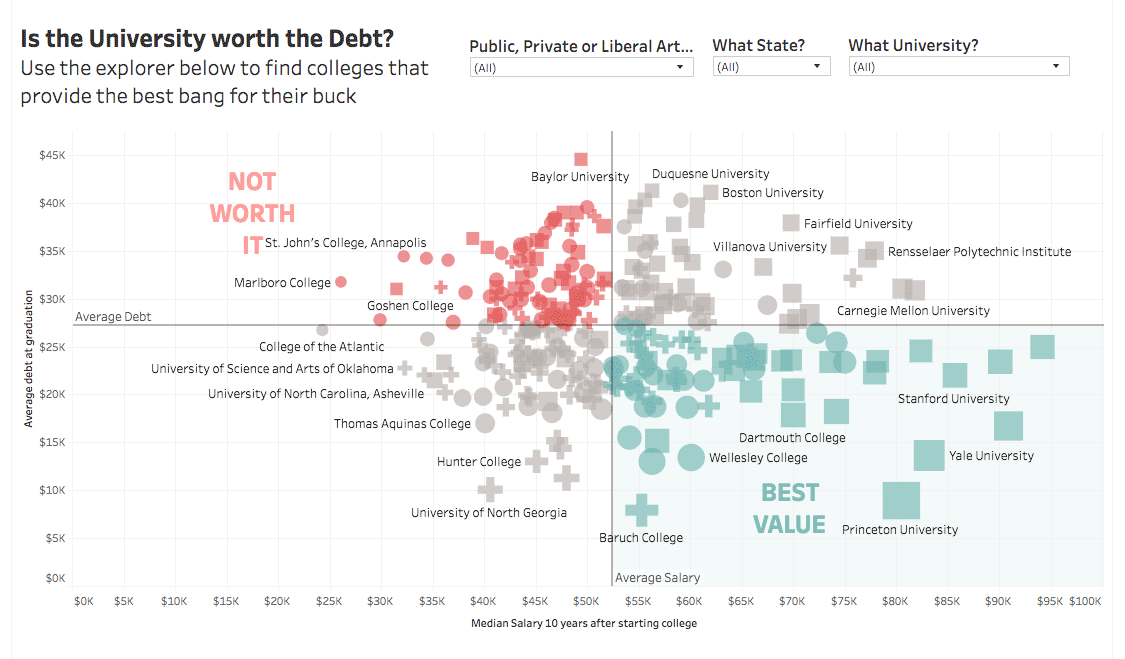
Is the University Worth the Debt?Interactive
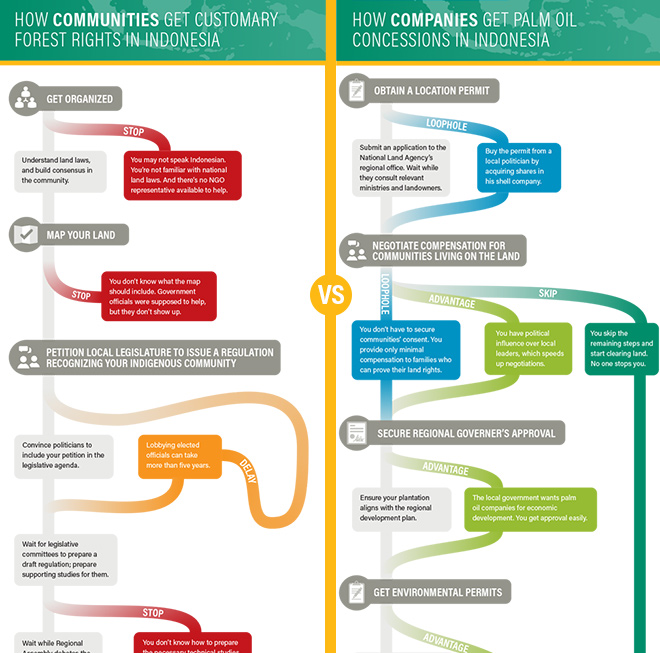
Scramble for Land RightsInfographic

Show FlyersConcert posters
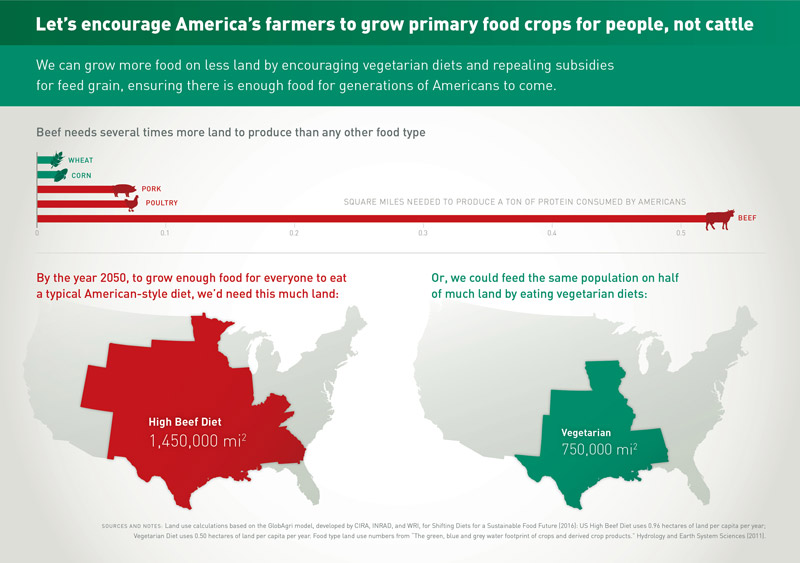
Land for Plants, not CattleInfographic
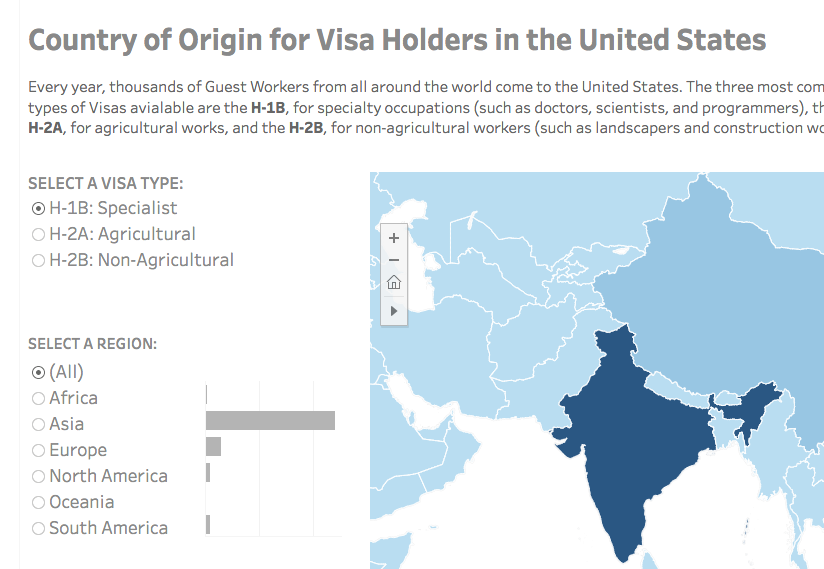
Visa Holders DashboardsInteractive
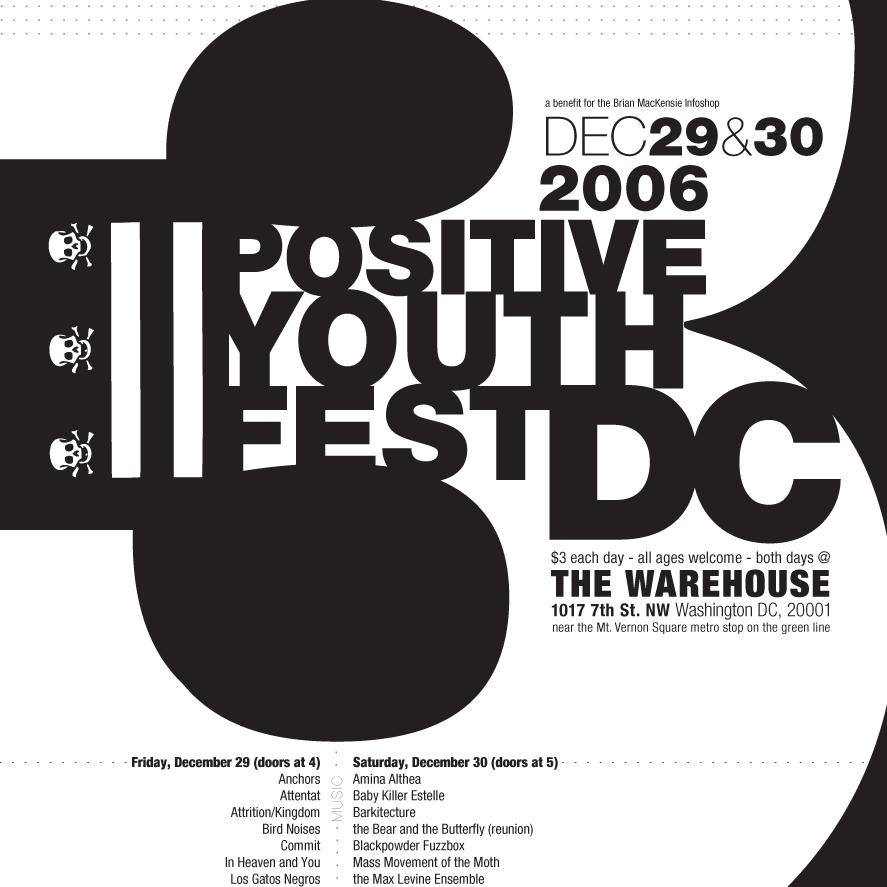
Positive Youth FestConcert Poster
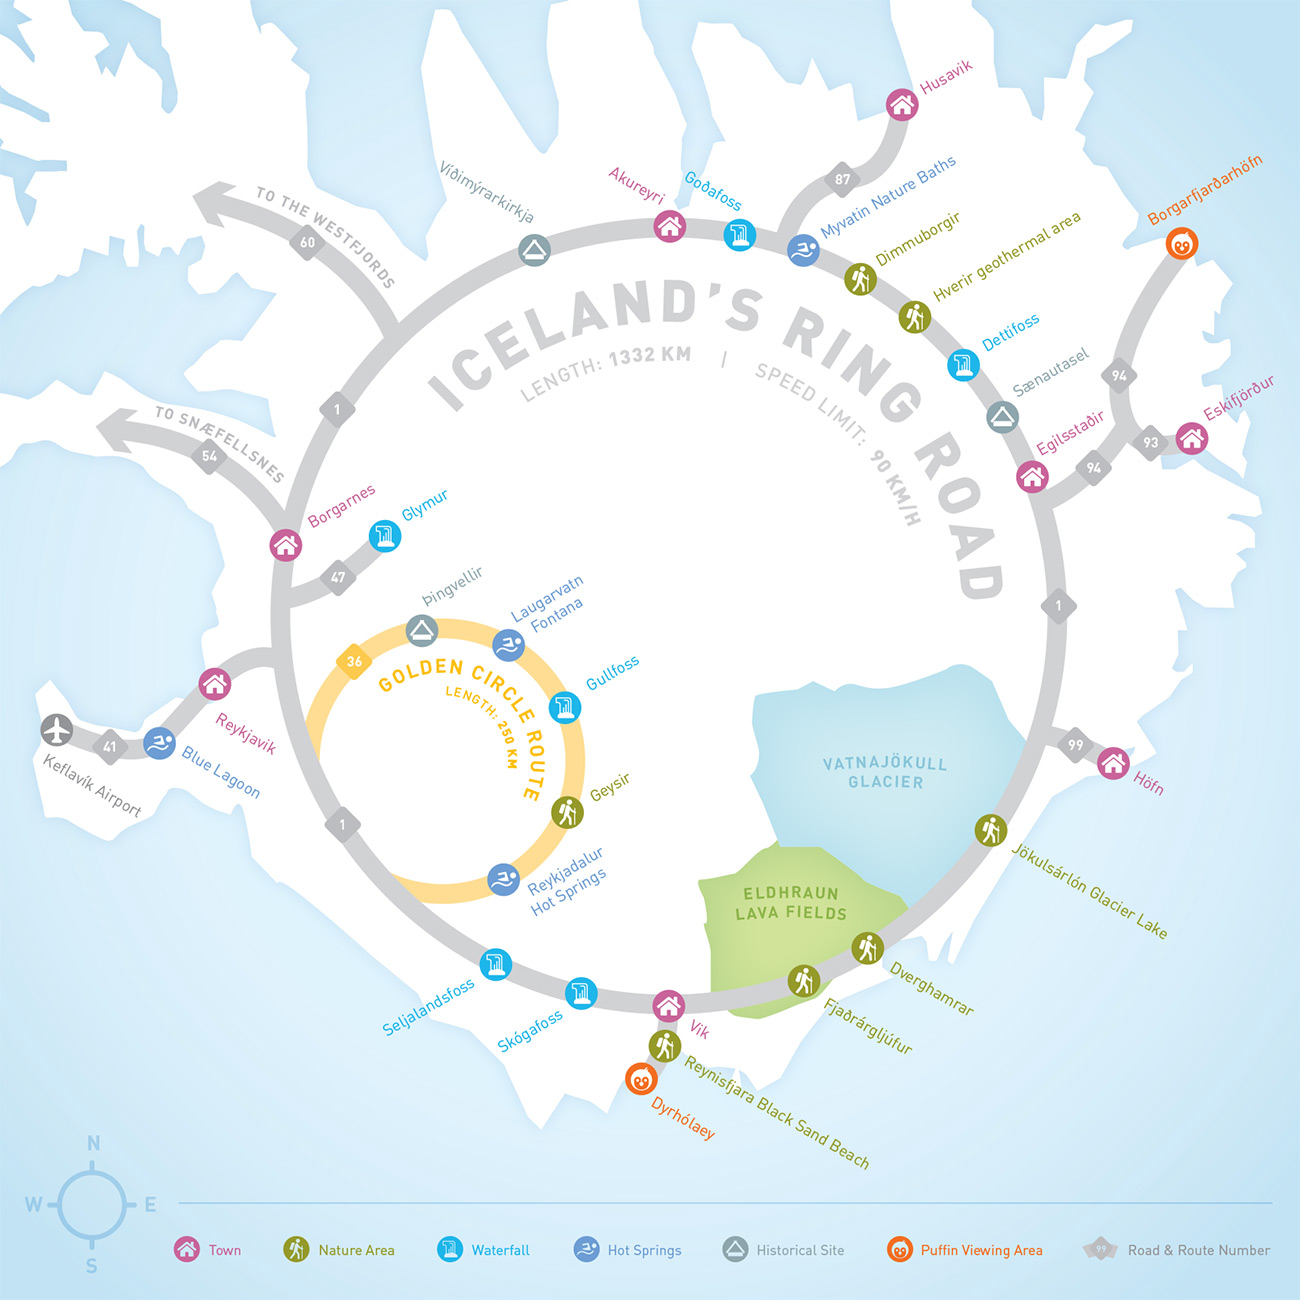
Iceland Ring Road MapInfographic
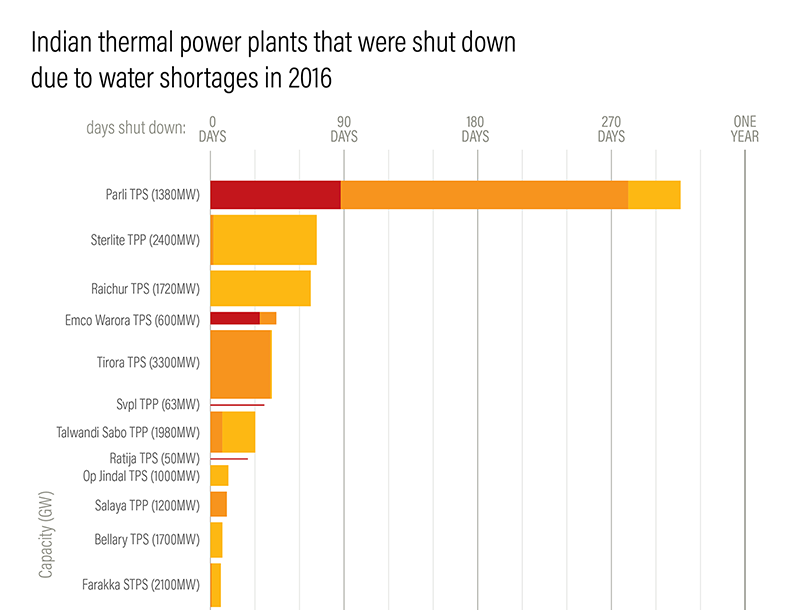
Droughts & BlackoutsData Visualization
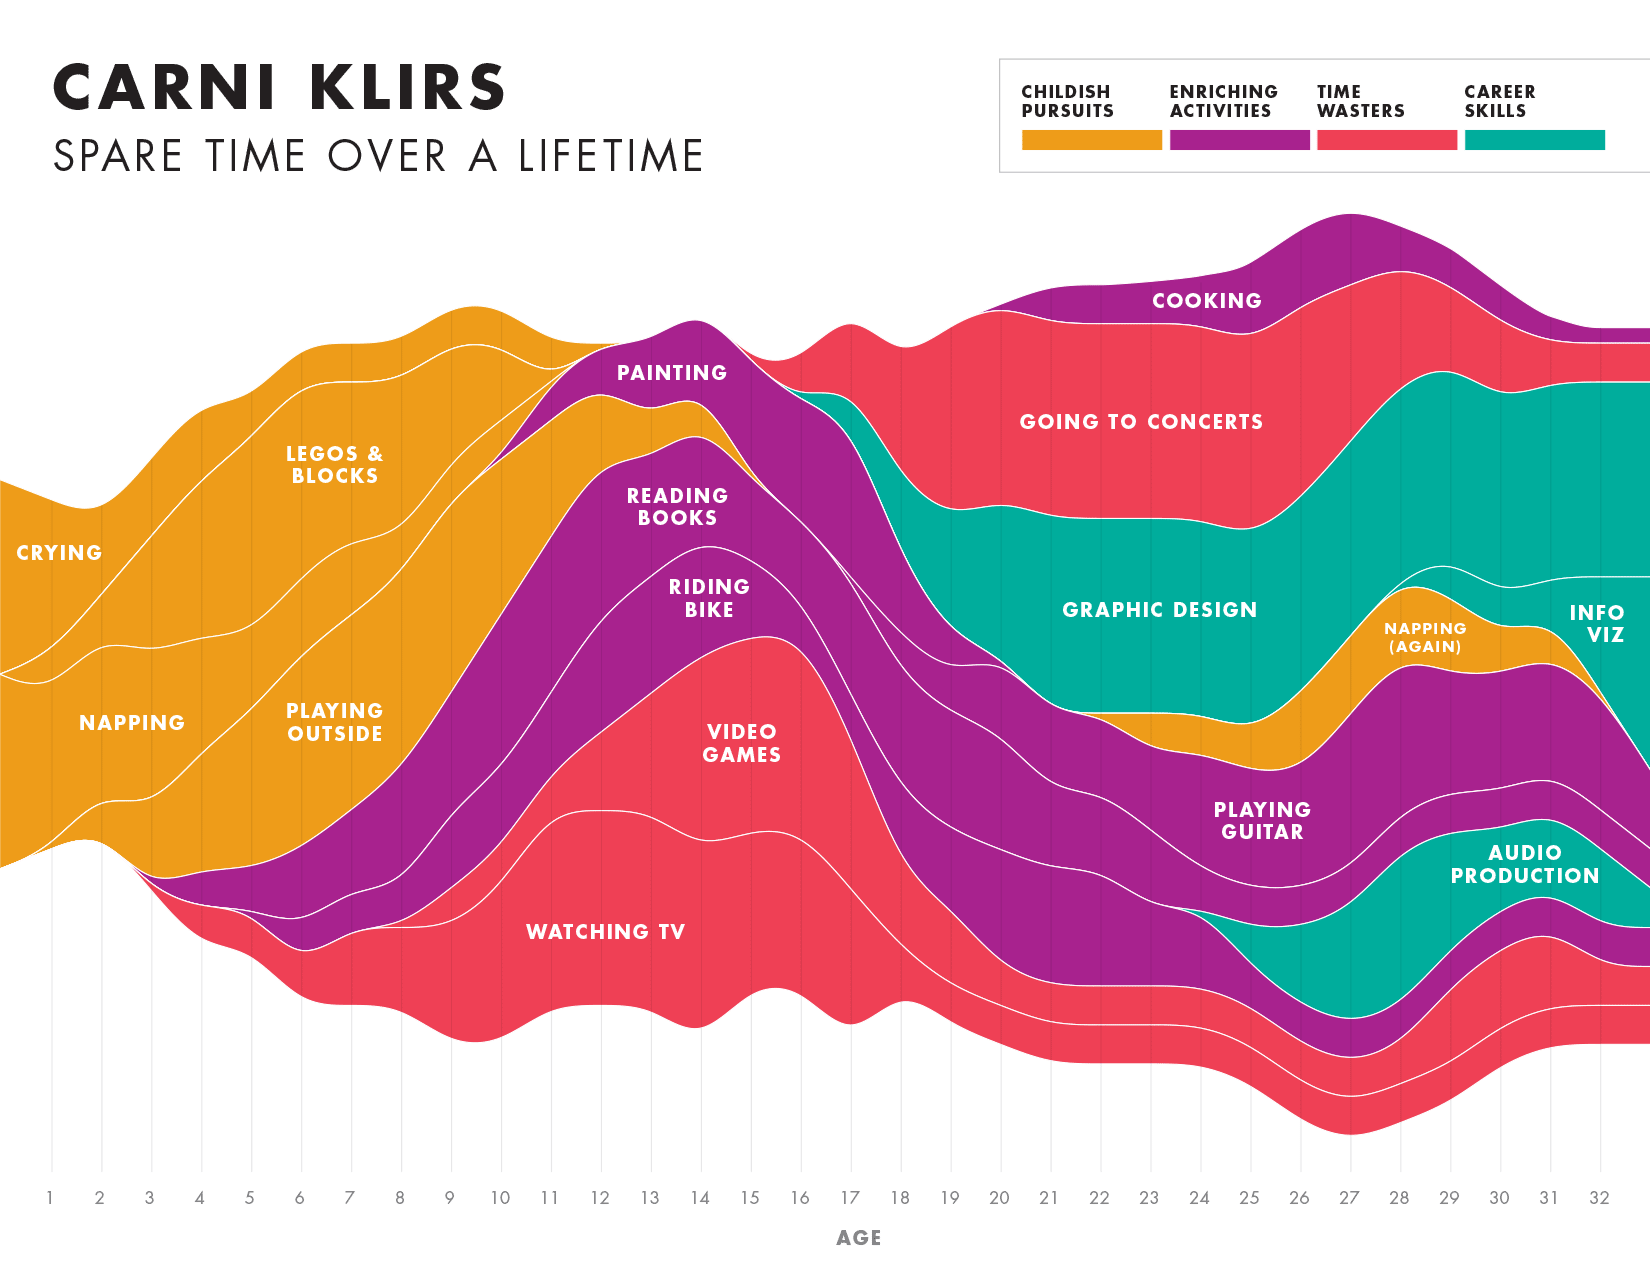
Spare Time over a LifetimeInfographic
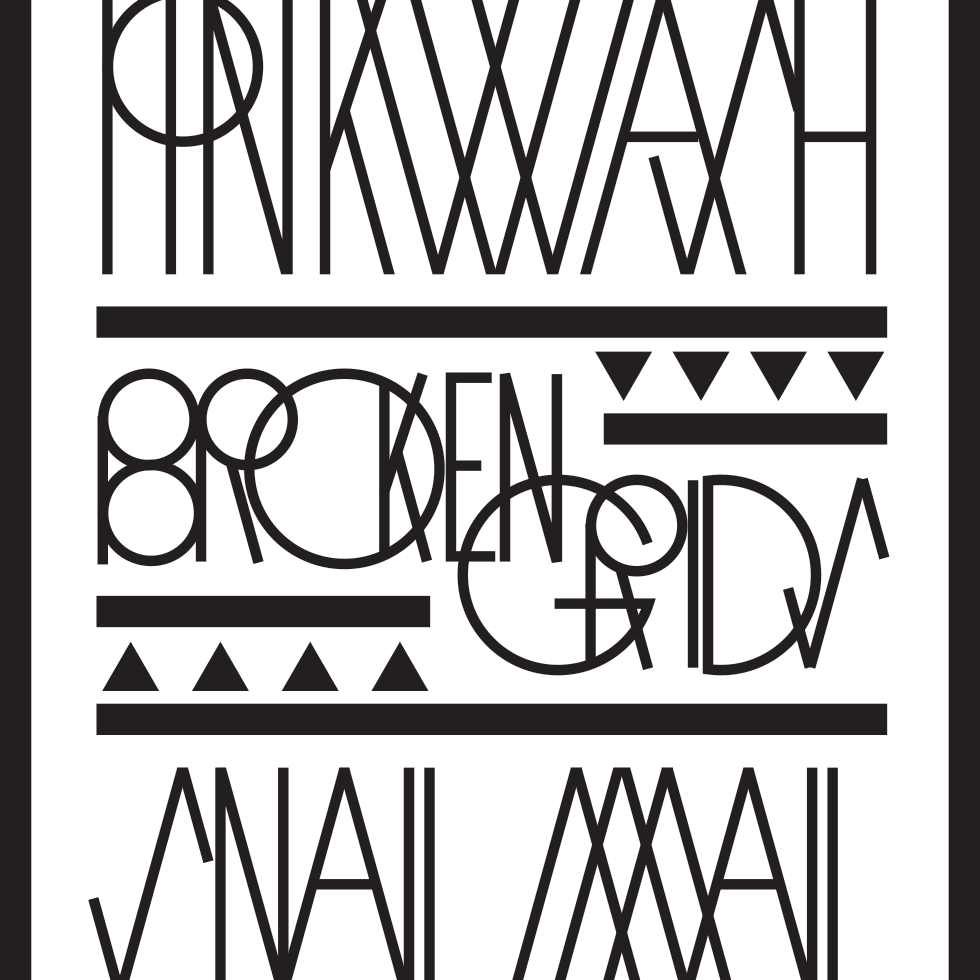
Pinkwash posterConcert Poster
Please be in touch: carni.klirs@gmail.com. Follow me on instagram or twitter.

