How to Record Your Band
INFOGRAPHIC | ILLUSTRATION
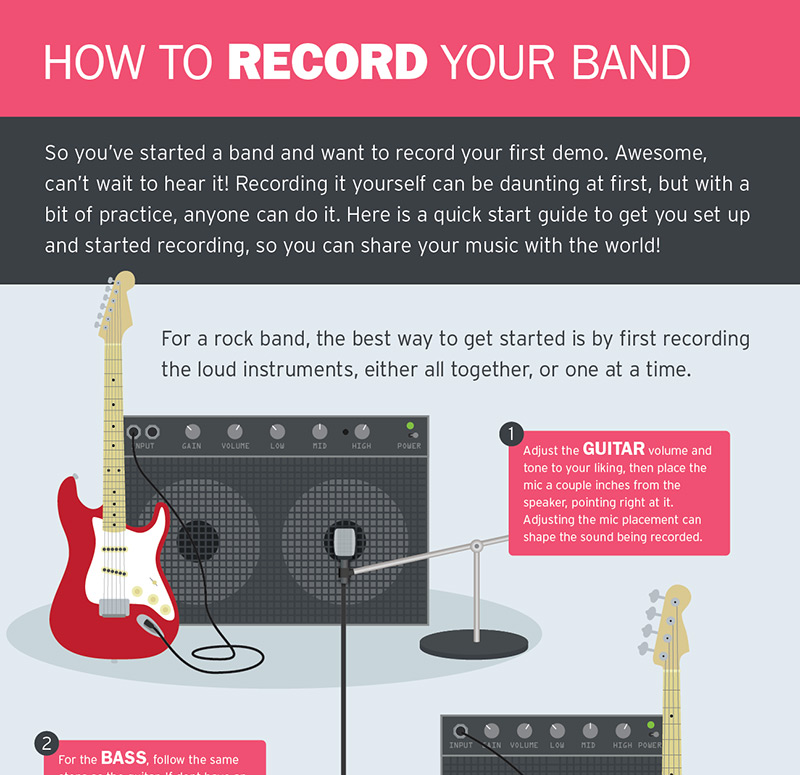
I created an explainer infographic about the recording process aimed at young musicians (age 13-18). I was a musician and played in bands throughout high school and college. The recording process always seemed really daunting, something that you had to pay a lot of money to do in a professional studio. As I had a DIY mentallity about a lot of things at the time, I spent considerable effort figuring out the process, through a combination of online tutorials and trial and error. I hit a lot of roadblocks and dead ends before I had a decent grasp of the process. I could have used a big picture overview, which covers how things plug into each other, and the general approach to recording a live band. So I designed an explainer infographic that I could have used when starting out. My only assumptions about the audience are that they are similar to where I was at 16: non-technical (some domain specific knowledge of music and instruments, but not of recording), but highly motivated.
As there is a significant gender disparity in music, especially in the recording profession, I wanted the color, type, and illustration choices to be as “gender-neutral” as possible. I wanted to make the recording process seem as accessible to anyone, so kept the language simple and non-technical. The visual styling of the illustrations is meant to be a half-way point between technical drawings and cartoons, so it would be eye-catching and engaging, but accurate enough to be useful as visual references to the real life equipment the reader will encounter while trying to record.

Other Projects:
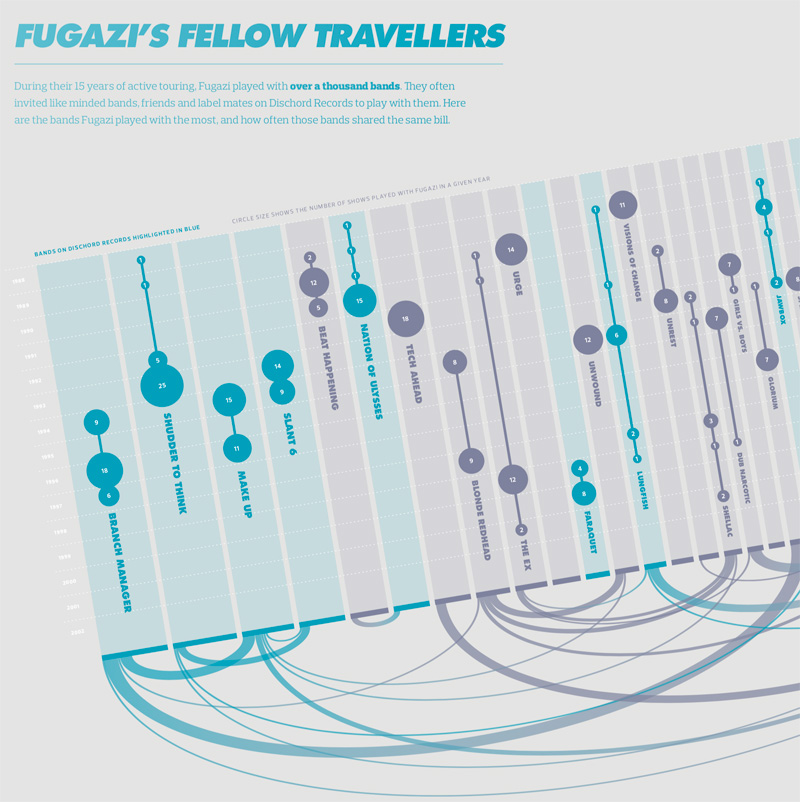
Visualizing the History of FugaziData Visualization
COVID-19 Testing Trends TrackerData Visualization
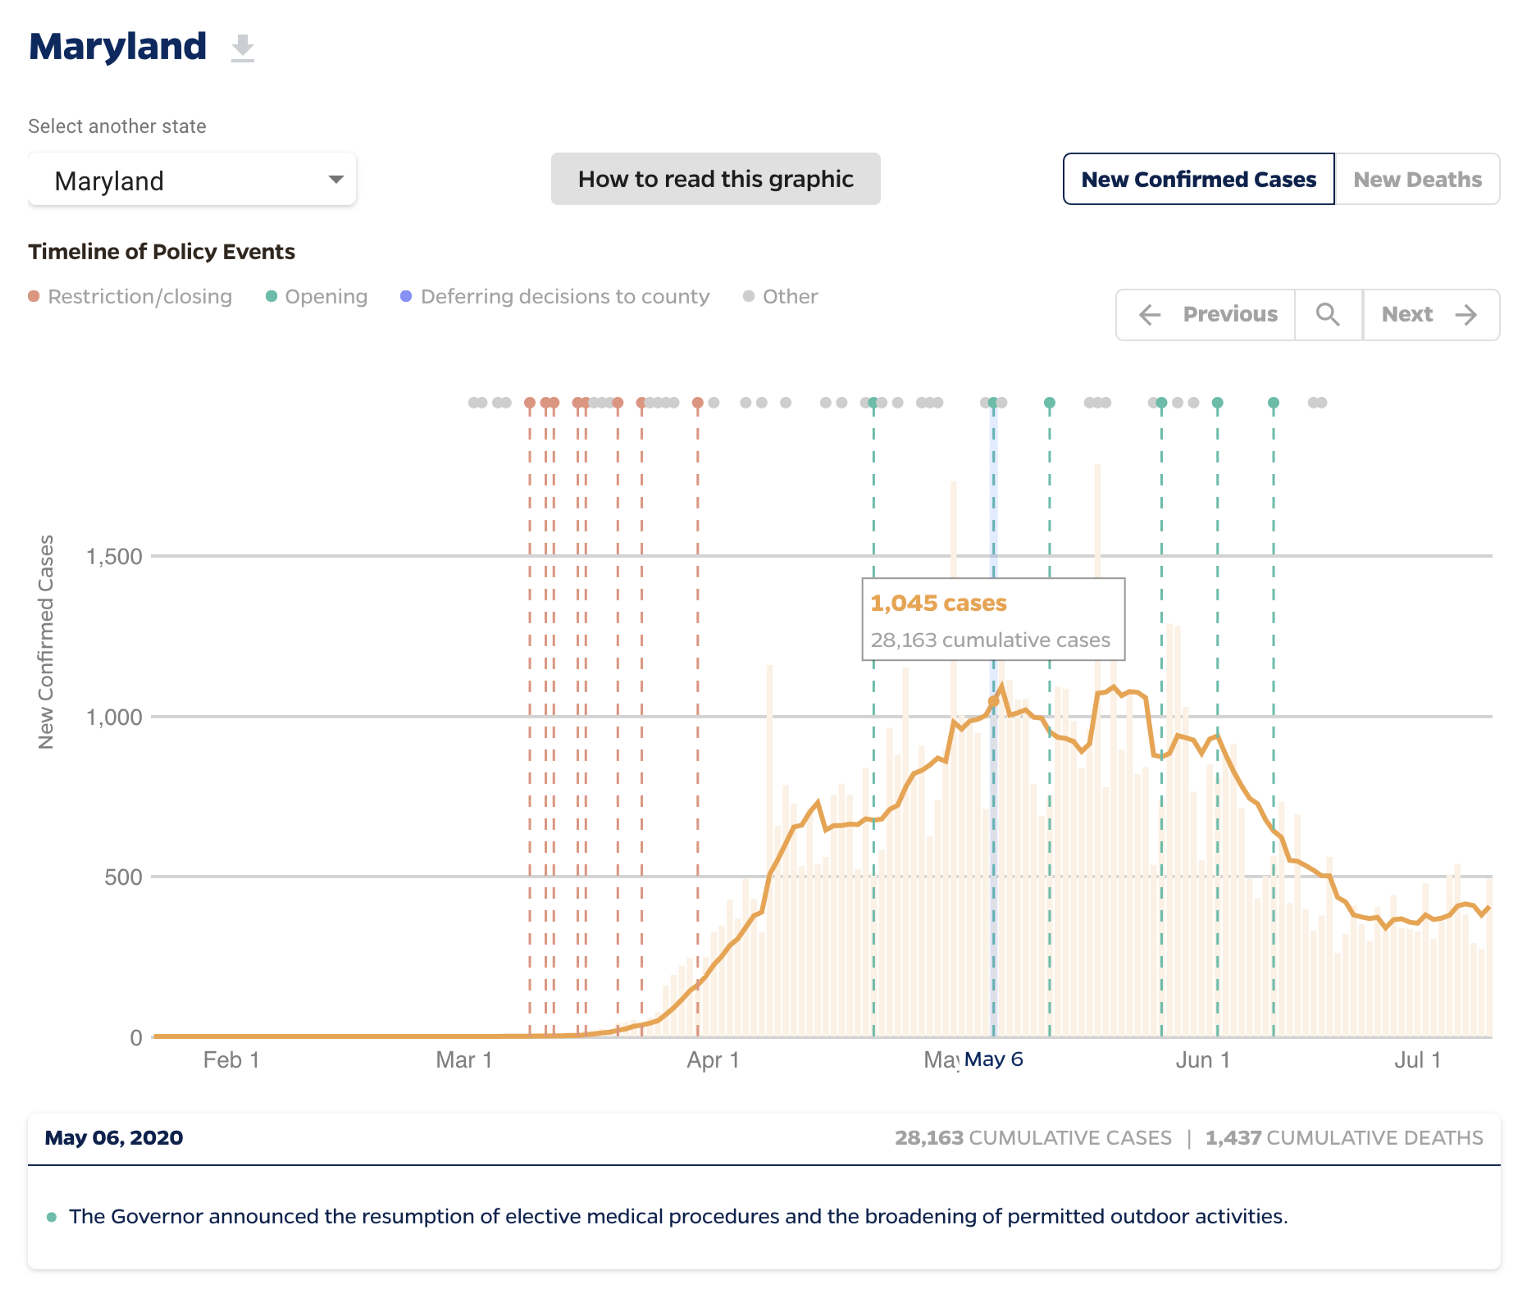
Timeline of COVID Policies in the U.S.Data Visualization
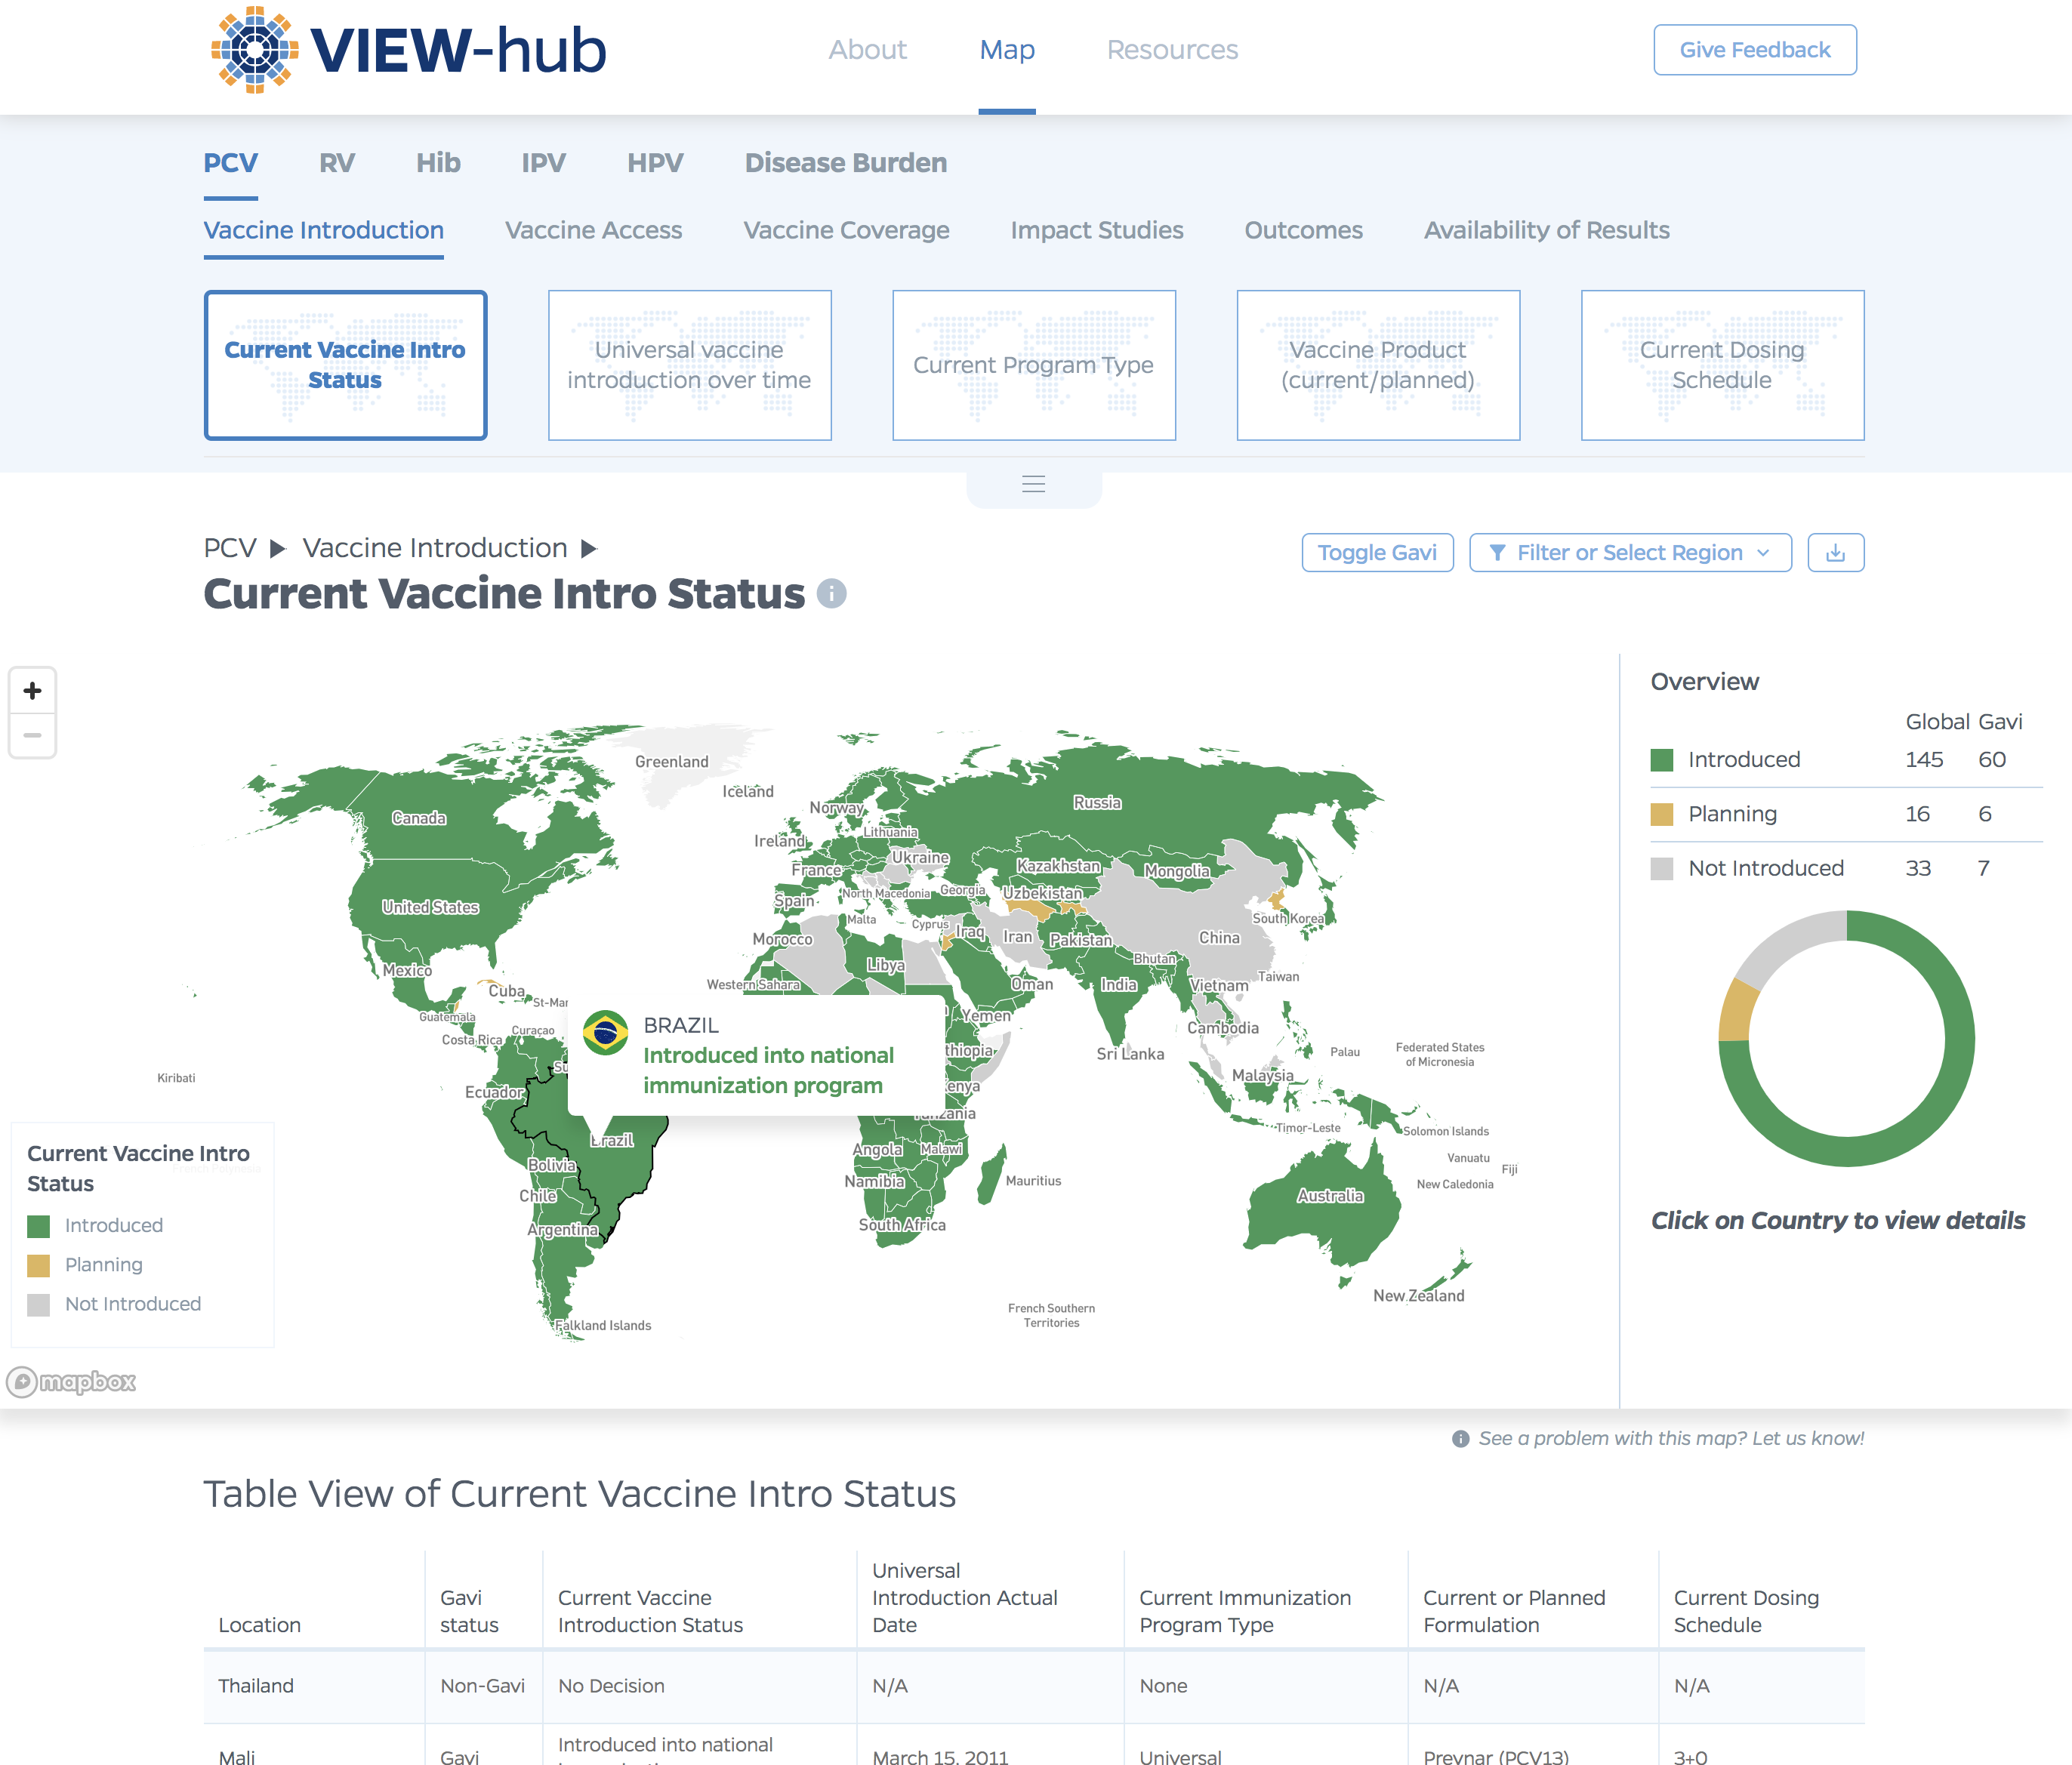
VIEW-hub website designUI/UX Design & Data Visualization
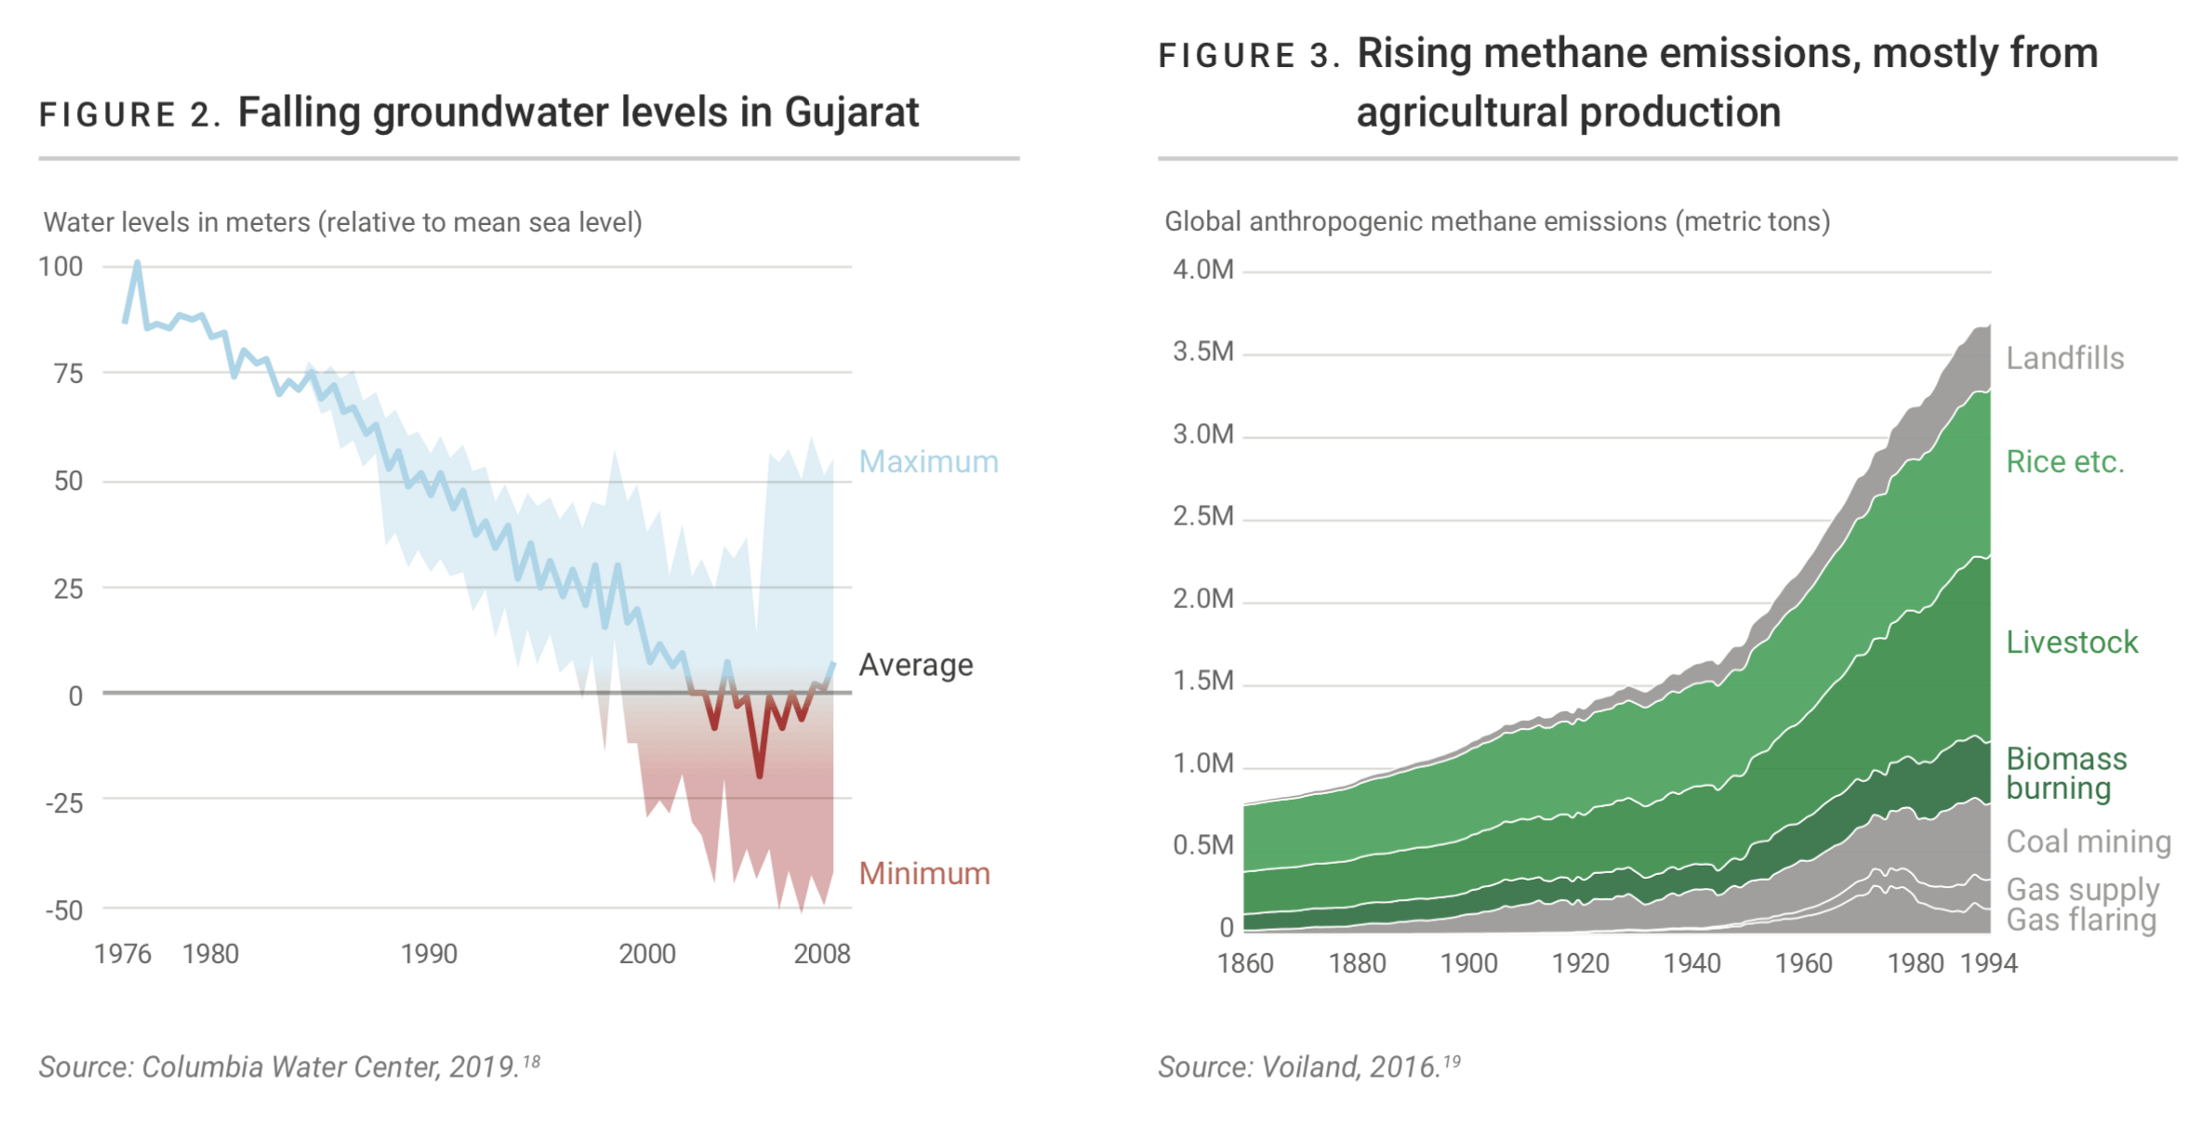
Transforming Food Systems Under Climate ChangeData Visualization & Report Design
Towards a More Equal CityData Visualization
Wide Reach of Arts Funding in MarylandData Visualization
Creating a Sustainable Food FutureData Visualization & Report Design
Global Commission on AdaptationMap & Infographic Design

Logo & Branding projectsLogo design
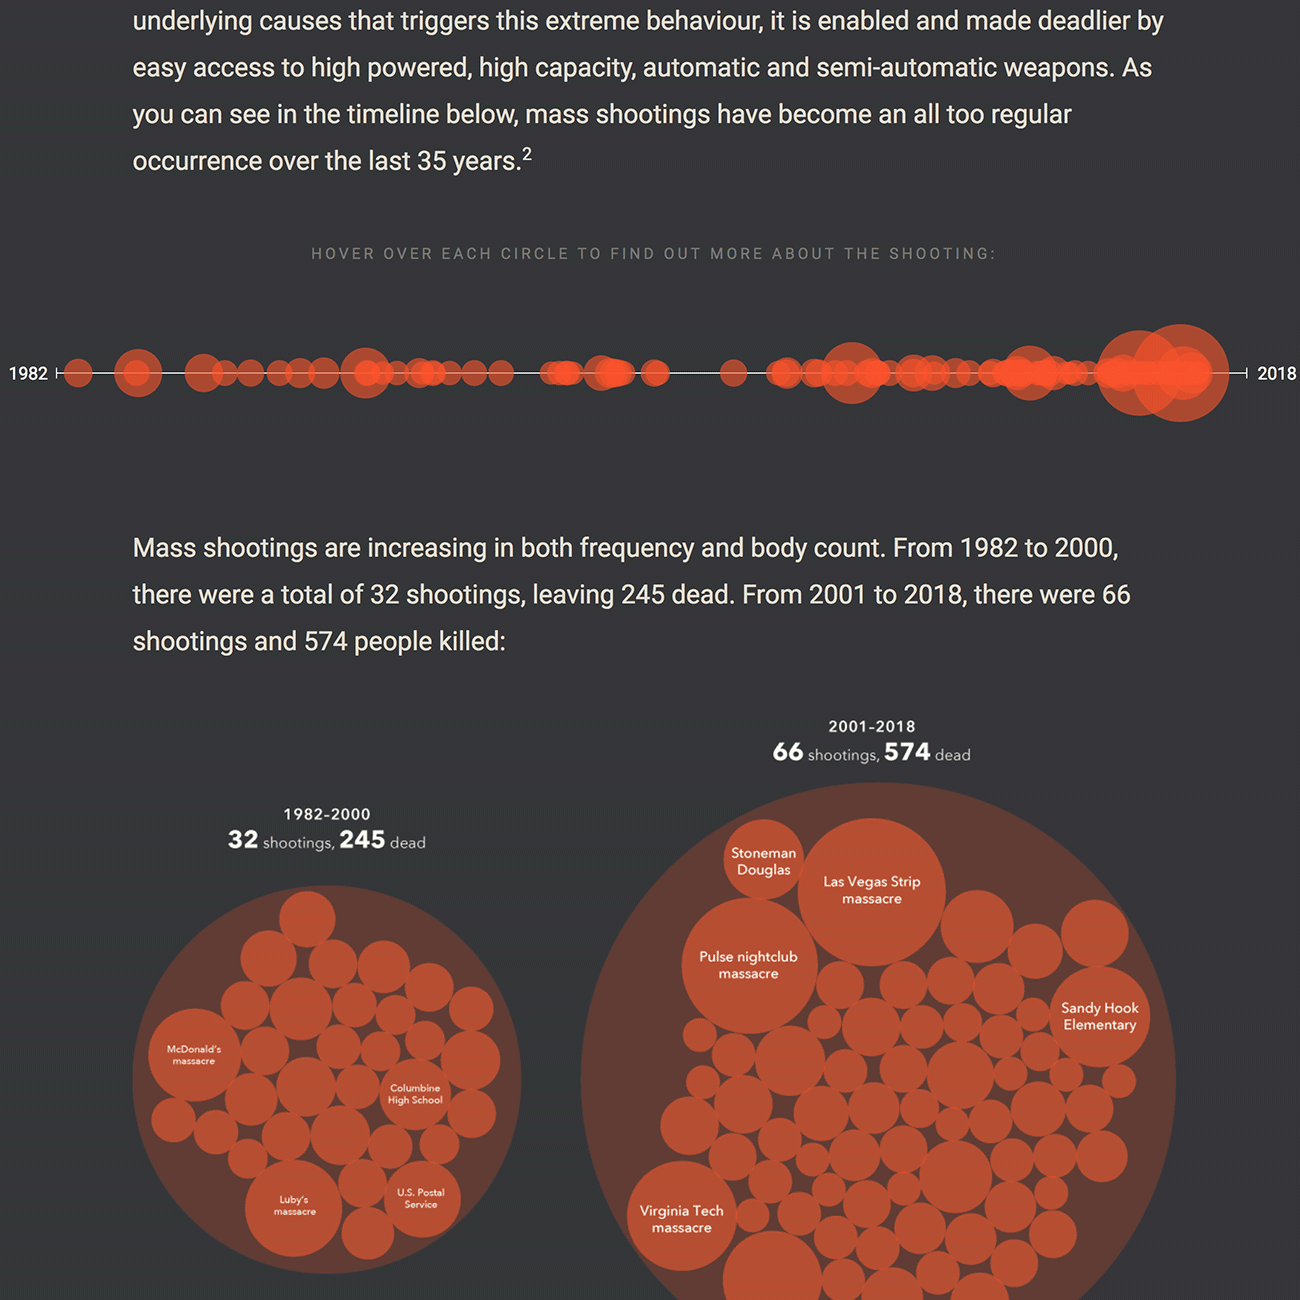
Sensible Gun Laws NowInteractive
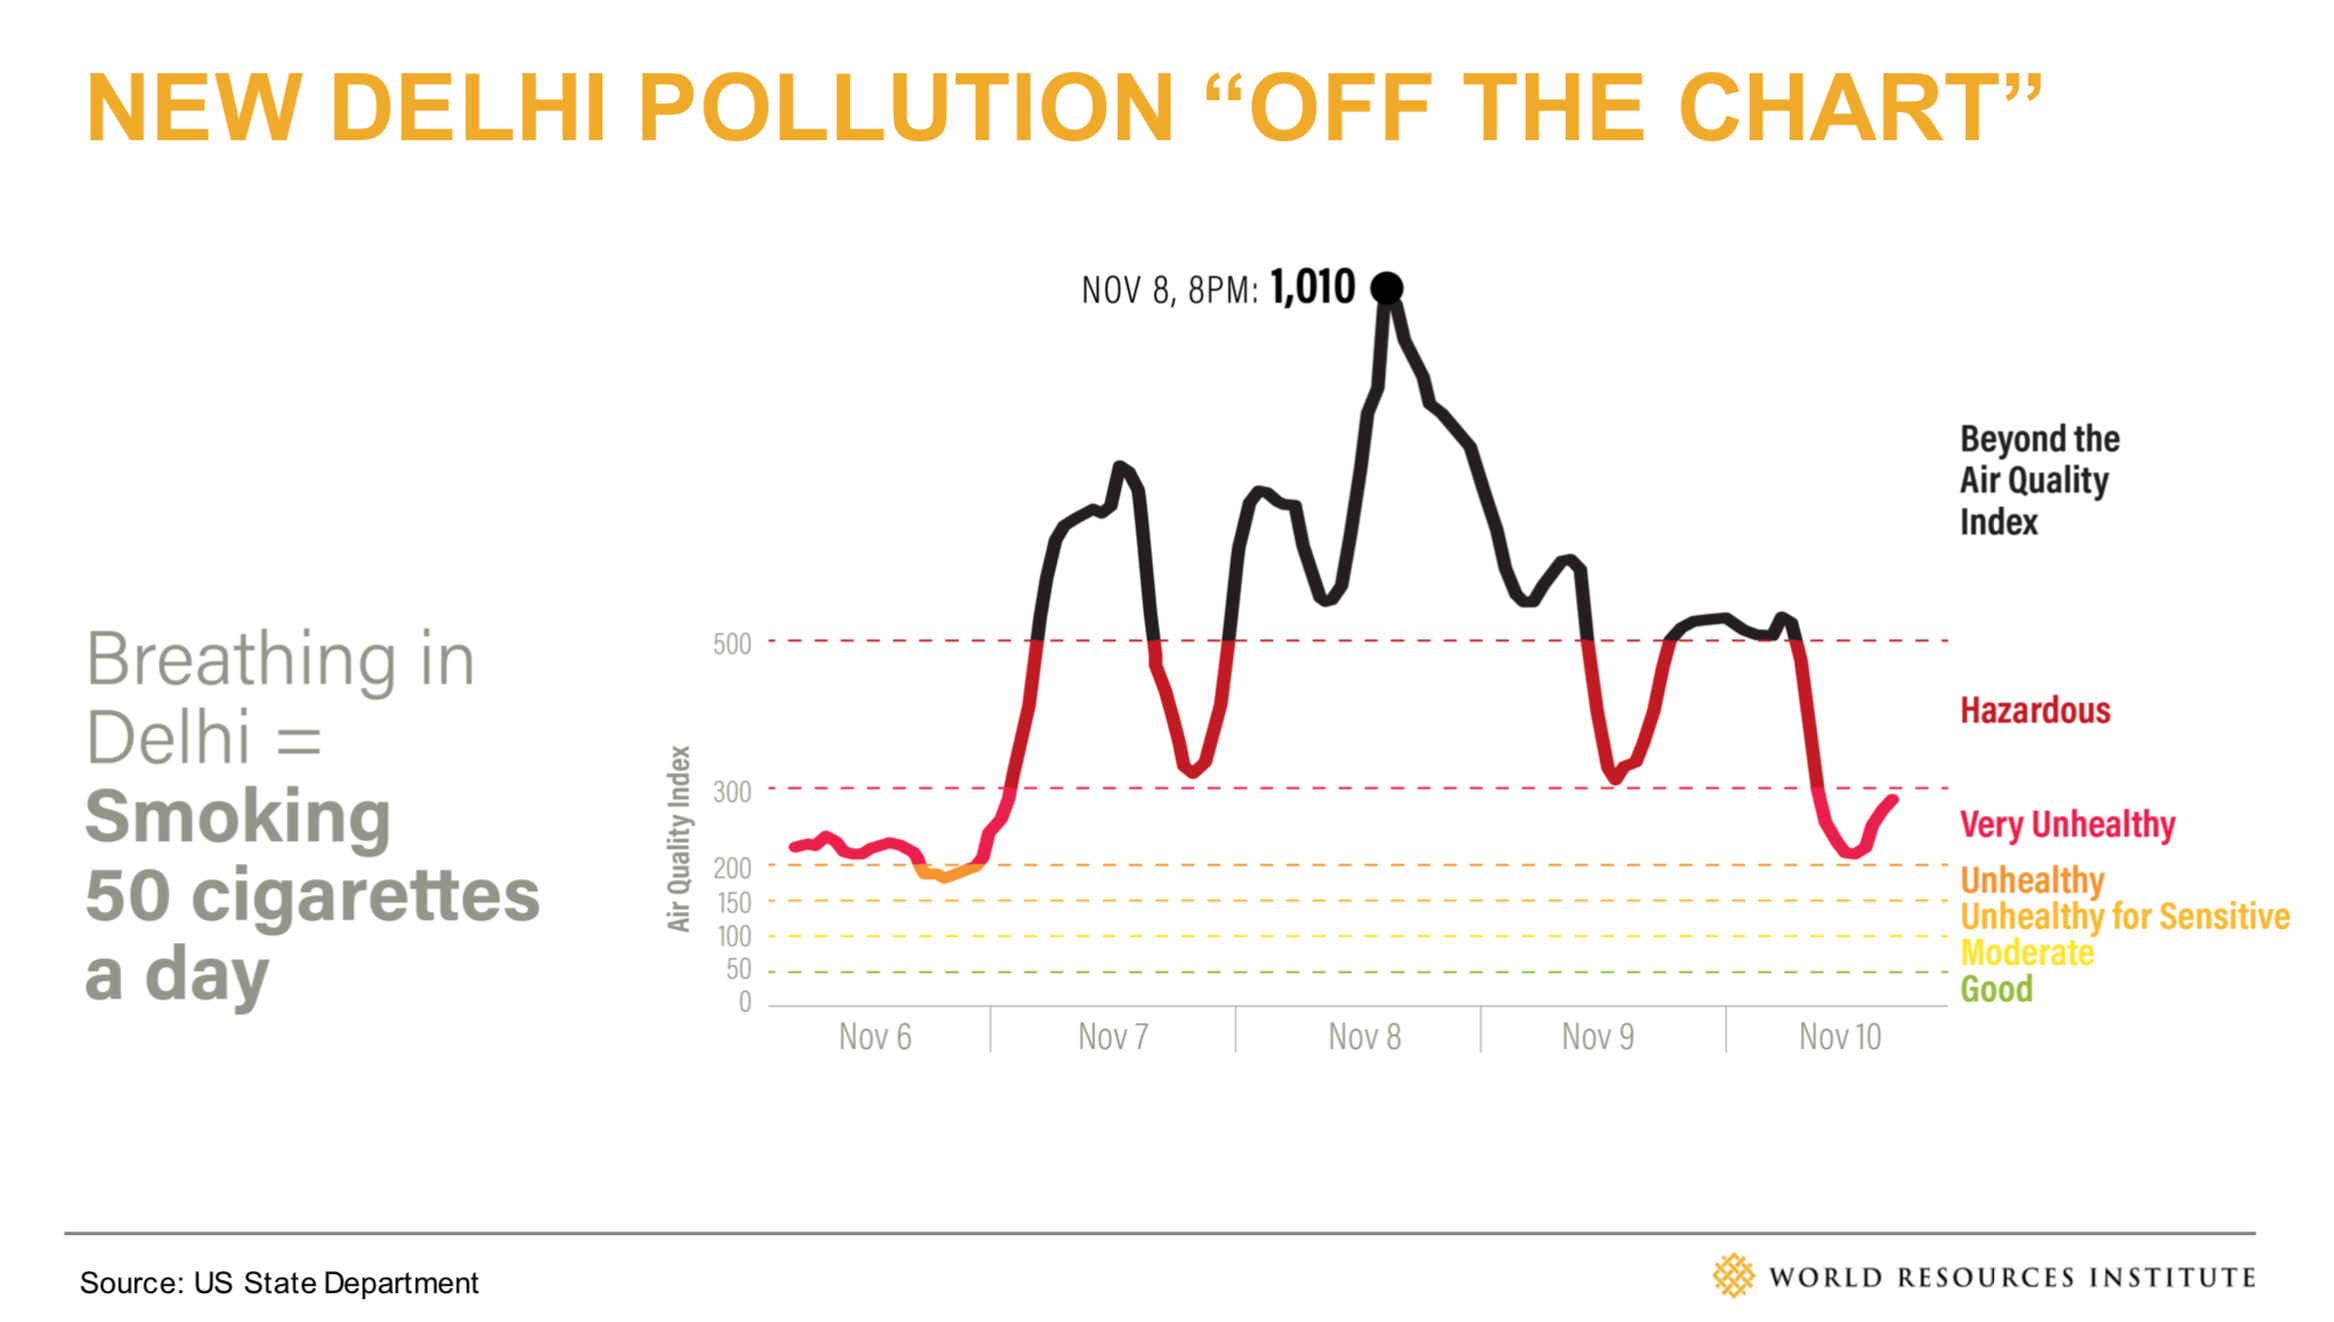
Stories to WatchPresentation Design
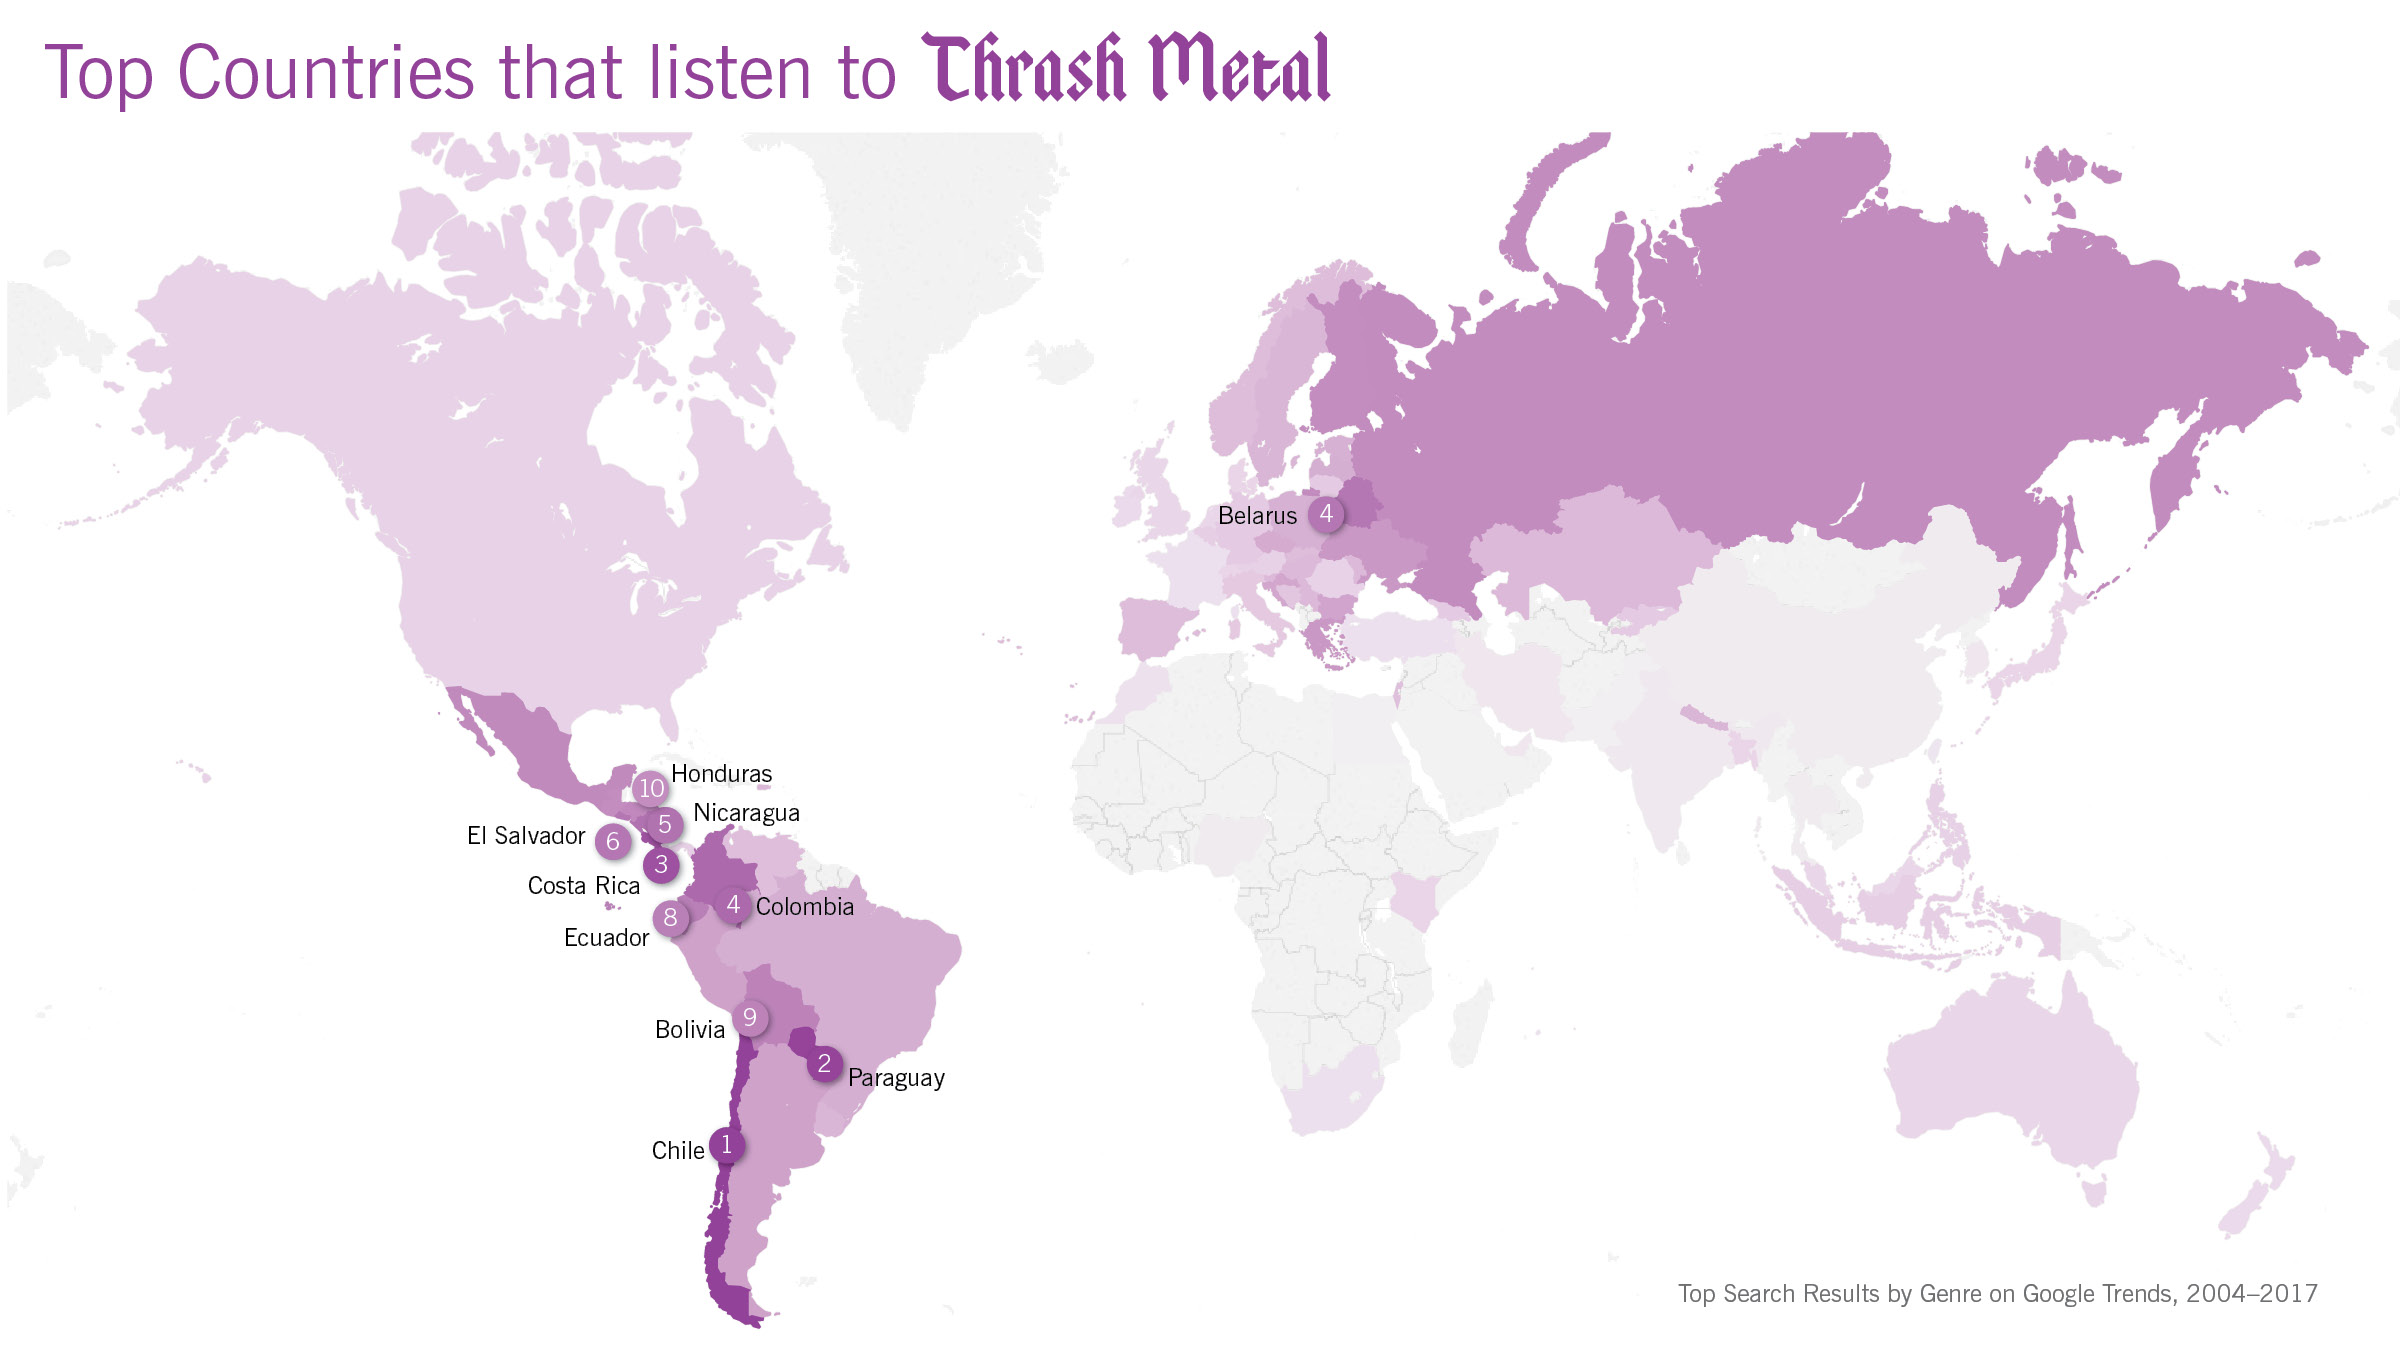
Globetrotting History of MetalData Visualization
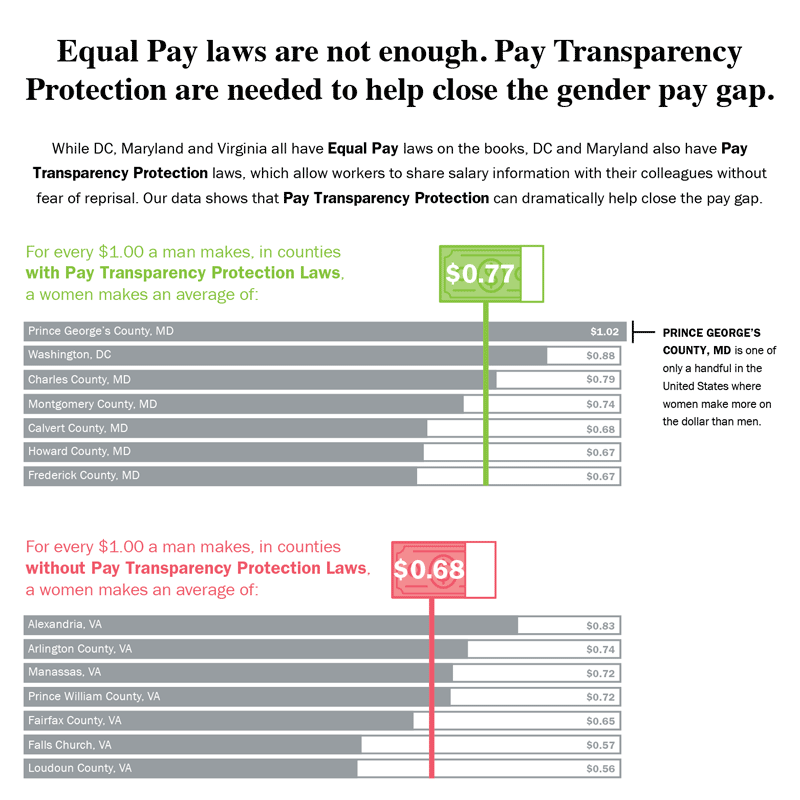
Equal Pay Laws are Not EnoughData Visualization
How to Record Your BandInfographic
WRI Blog graphicsCharts & graphs
The Slow Recovery from the Great RecessionInteractive
The Race to the MoonInfographic
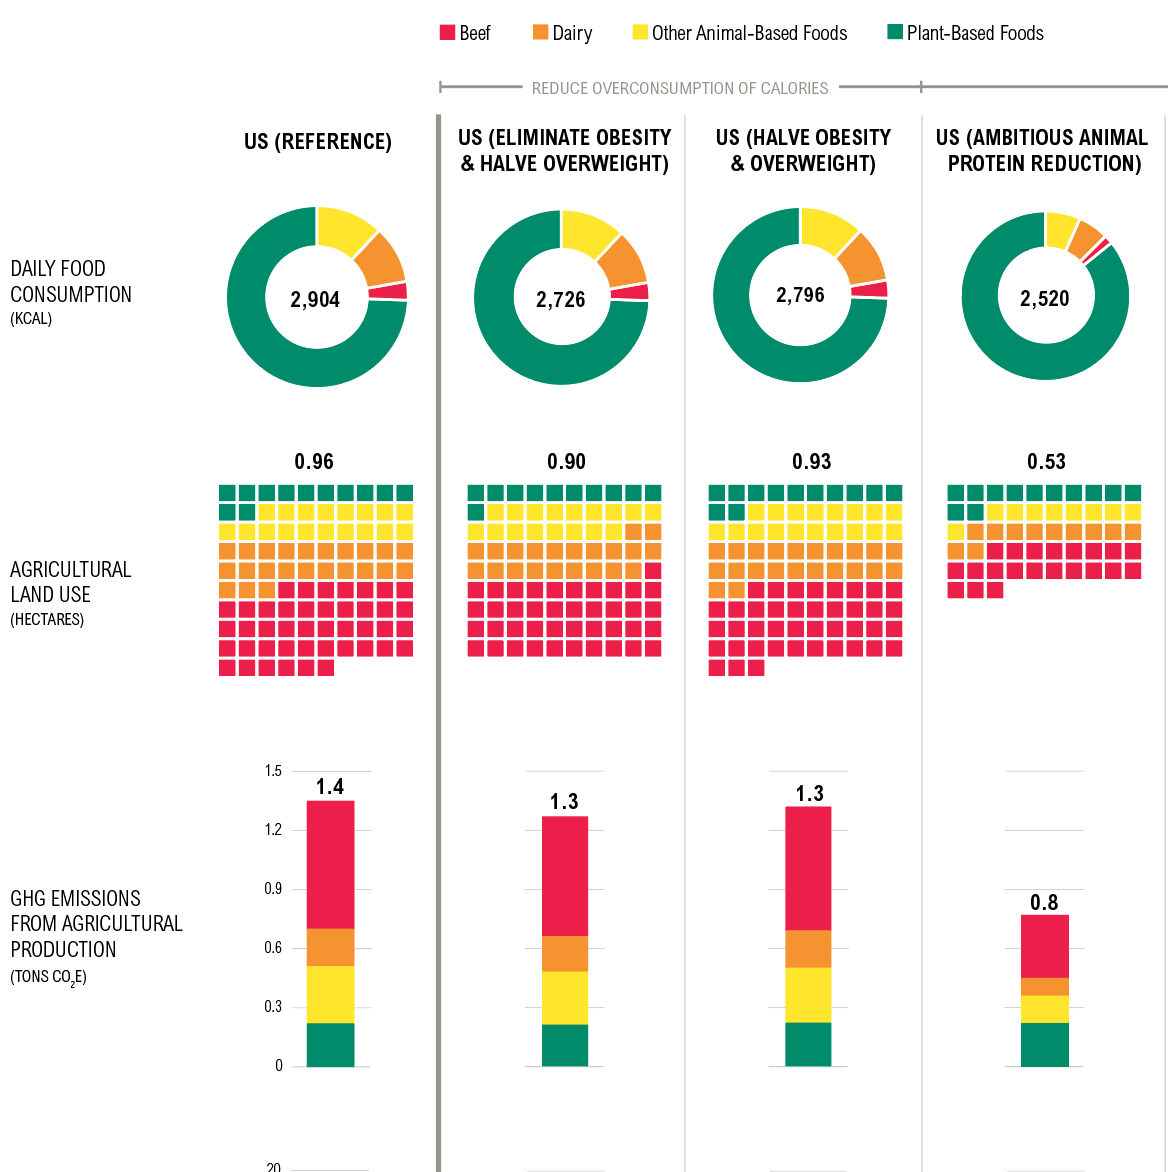
Shifting DietsData visualization
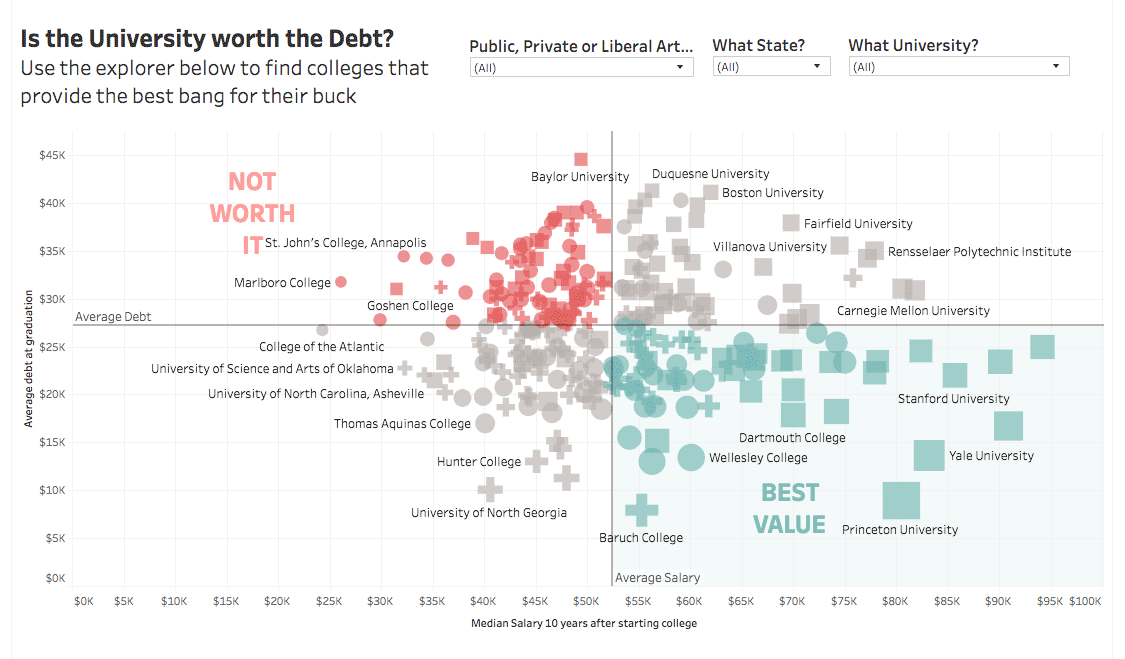
Is the University Worth the Debt?Interactive
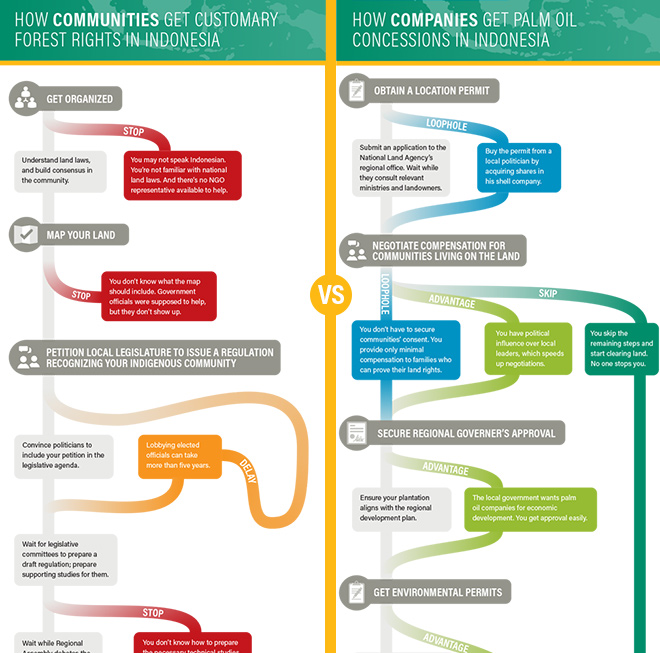
Scramble for Land RightsInfographic

Show FlyersConcert posters
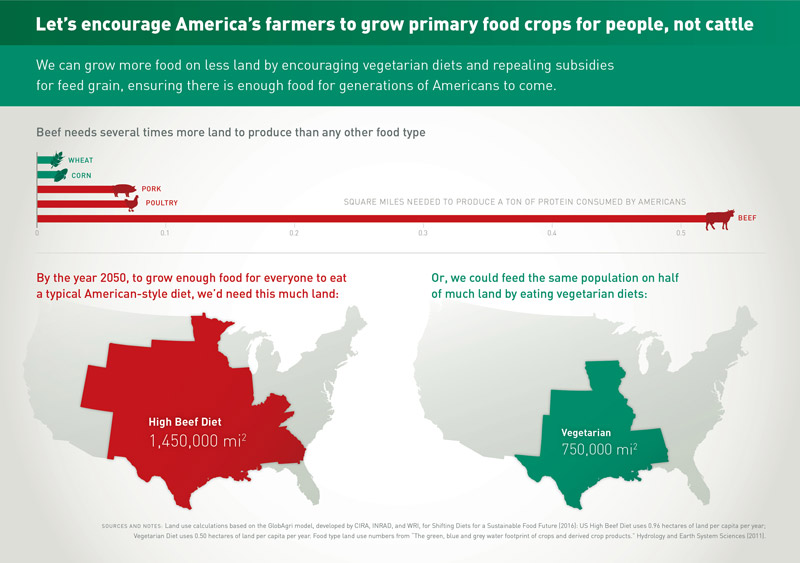
Land for Plants, not CattleInfographic
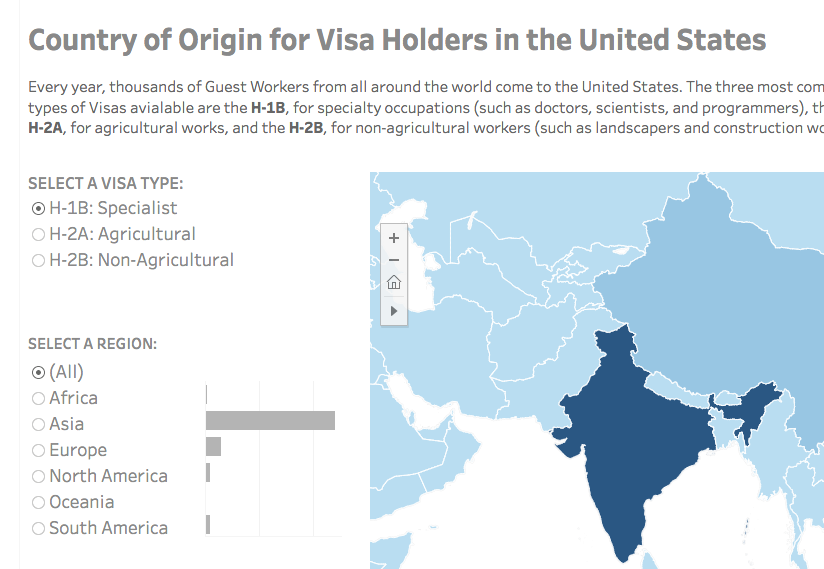
Visa Holders DashboardsInteractive
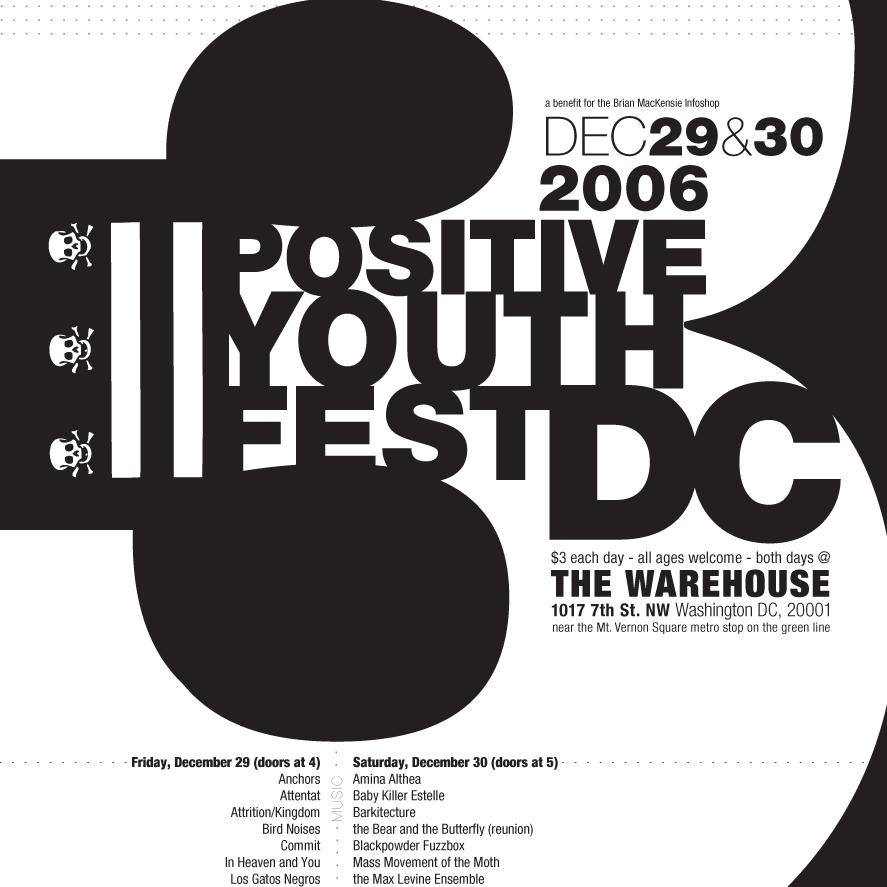
Positive Youth FestConcert Poster
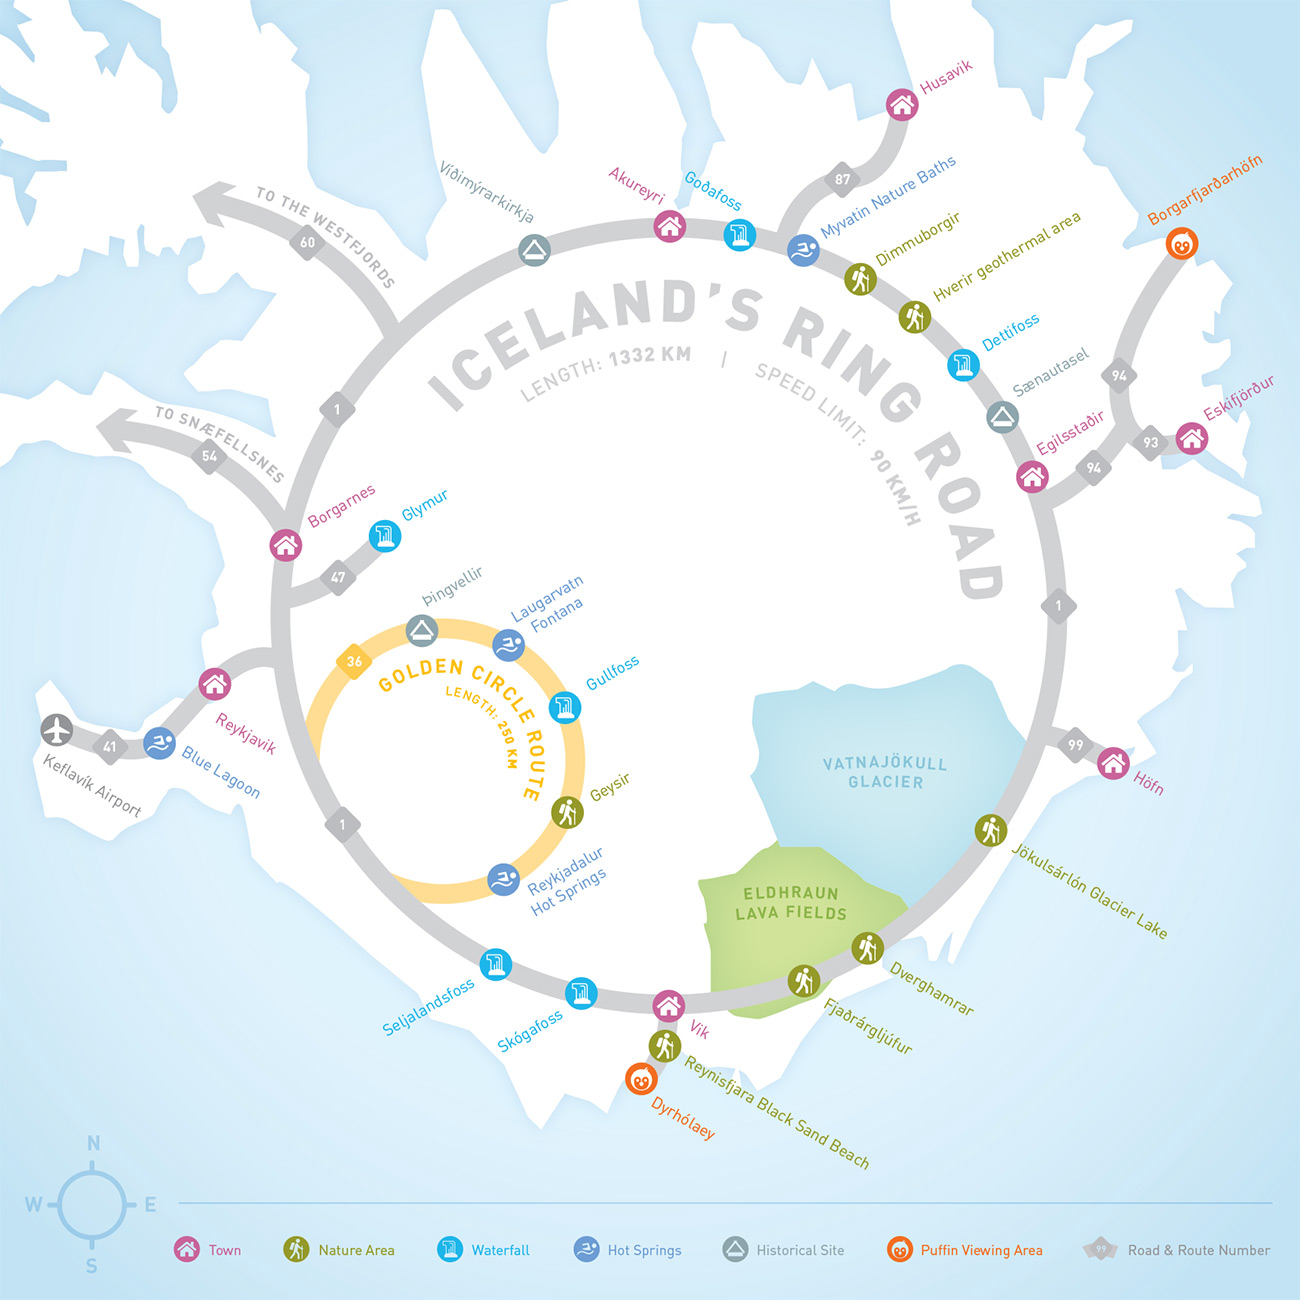
Iceland Ring Road MapInfographic
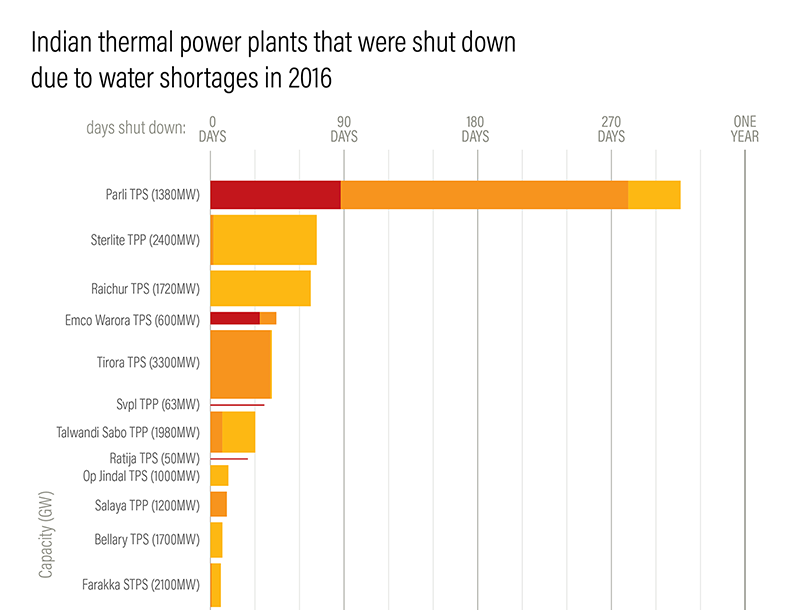
Droughts & BlackoutsData Visualization
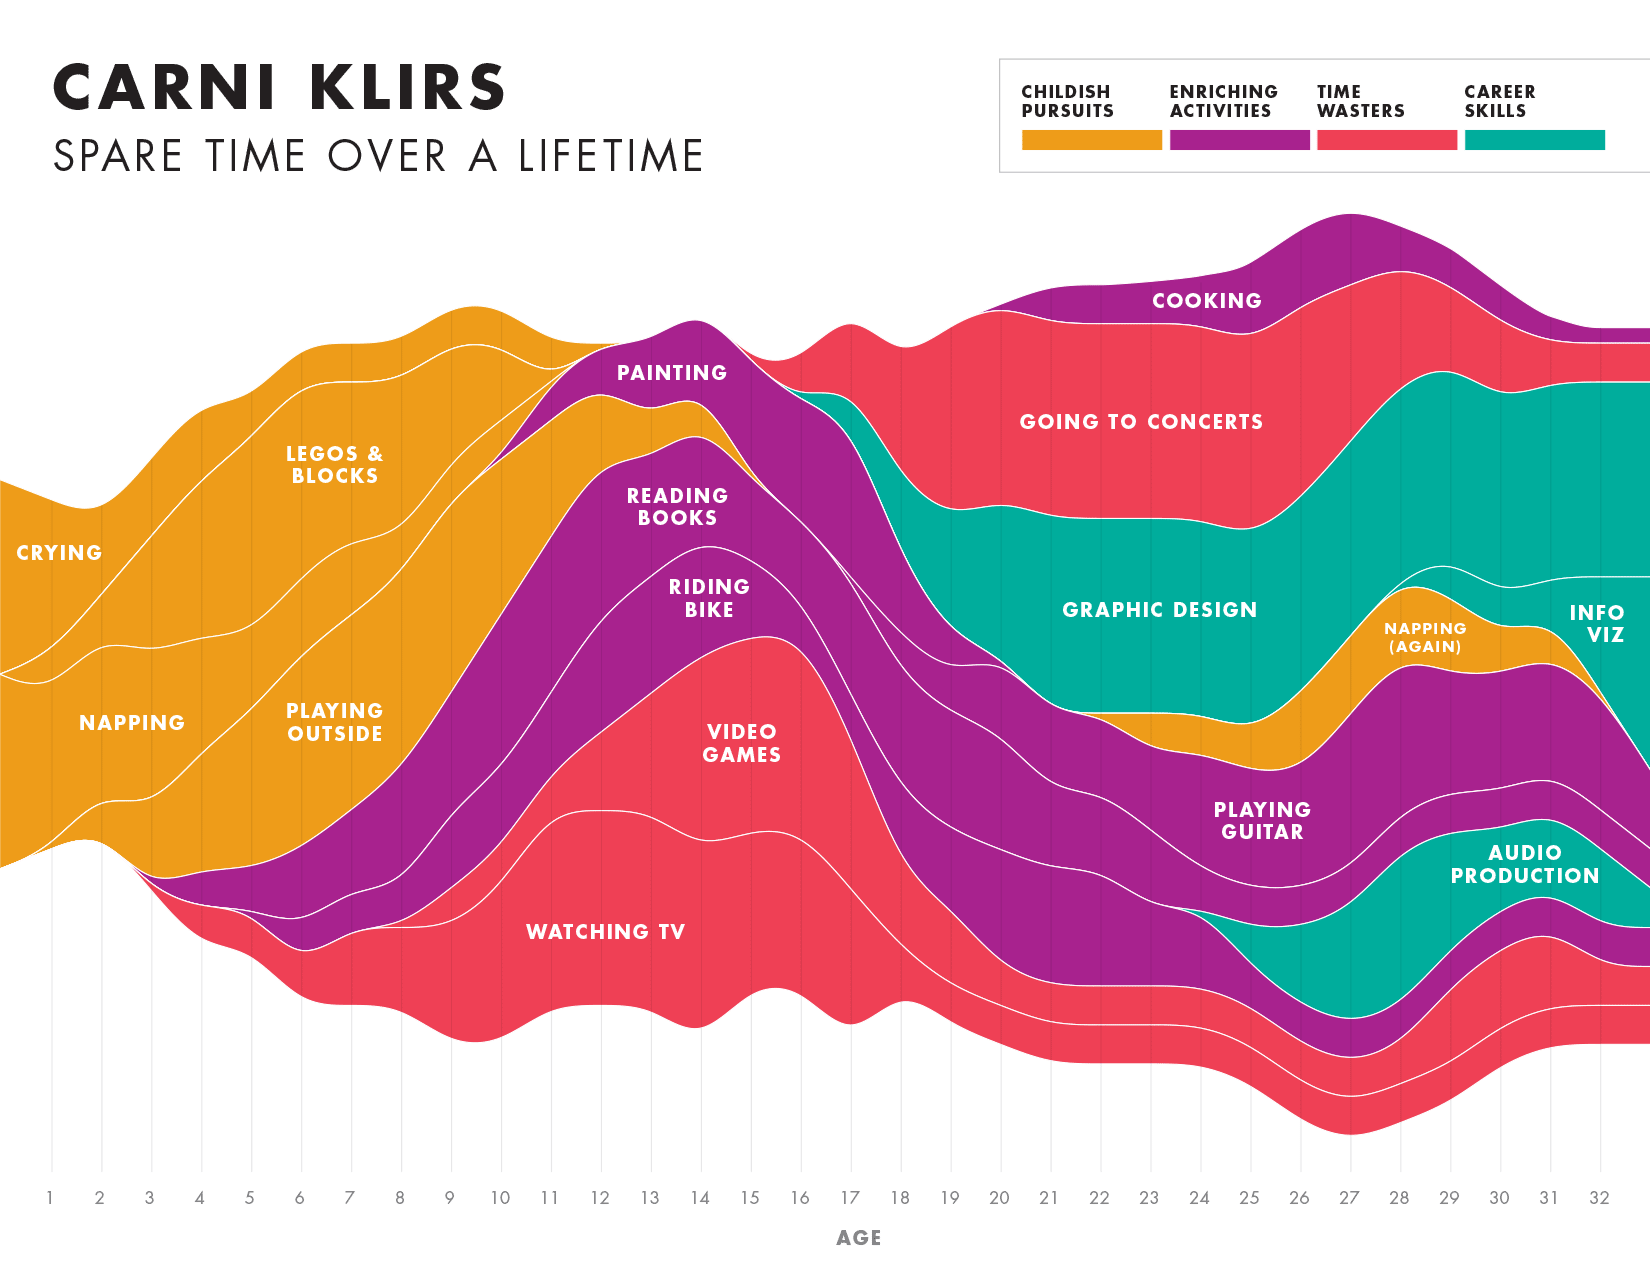
Spare Time over a LifetimeInfographic
Pinkwash posterConcert Poster
Please be in touch: carni.klirs@gmail.com. Follow me on instagram or twitter.